For any queries, email us at [email protected]


For any queries, email us at [email protected]


For any queries, email us at
[email protected]


One of the commonly fielded requests here has always been about ways to enter/exit the crypto market. Crypto can be overwhelming, and an indicator telling you when to enter or exit can be quite a good starting point. In this article, we discuss an indicator which would help you determine what position you’ve to take, when you’ve to enter, and when you’ve to exit – the Rising and Falling Three Methods.
What's in this post
Falling Three Methods is a bearish reversal pattern typically seen at the top of an uptrend. This pattern is identified by three consecutive long red candle sticks:
On the other hand, the Rising Three Methods is a bullish reversal pattern that is typically seen at the bottom of a downtrend and is characterized by three consecutive long white candlesticks:
The Rising Three Methods and Falling Three Methods are commonly used in technical analysis to predict the reversal of a current trend. These patterns are used by traders to identify potential buying or selling opportunities in the market.
The Rising Three Methods is considered a bullish reversal pattern and is typically seen at the bottom of a downtrend. This pattern suggests that the market may be about to change direction and start moving upward. When this pattern is identified, traders may use it as a signal to enter a long position, which is a bet that the price will go up.
The Falling Three Methods is considered a bearish reversal pattern and is typically seen at the top of an uptrend. This pattern suggests that the market may be about to change direction and start moving downward. When this pattern is identified, traders may use it as a signal to enter a short position, which is a bet that the price will go down.
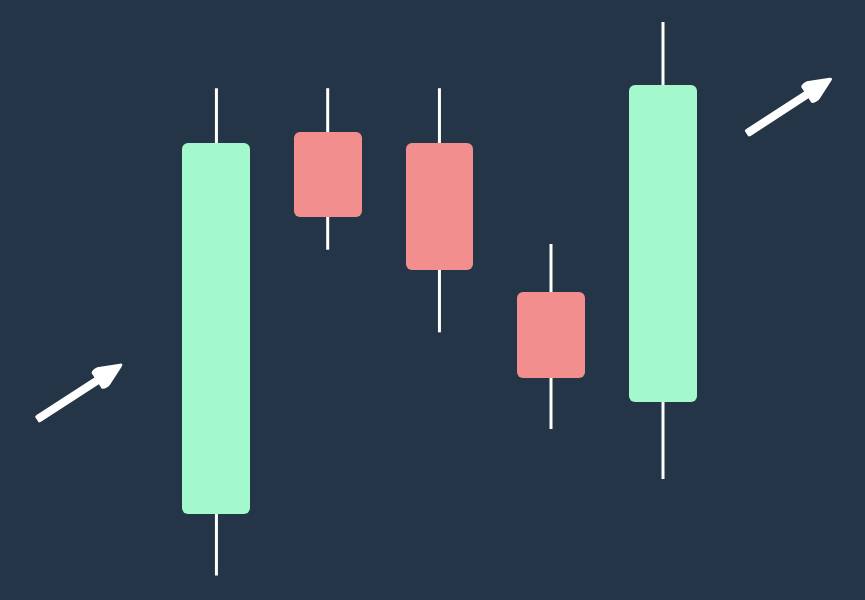
To identify the Rising Three Methods pattern, you should look for the following characteristics:
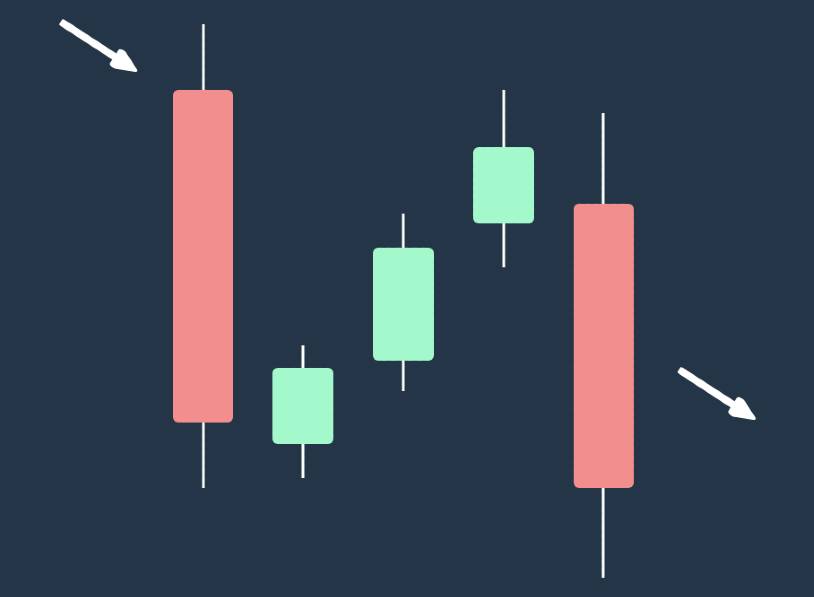
To identify the Falling Three Methods pattern, you should look for the following characteristics:
In Rising Three Methods, the last candle is a key factor in determining the continuation of the trend after a correction. If the price remains within the body of the last candle, it is likely to continue moving higher. If the price falls below the low of the first candle, it invalidates the trend continuation pattern.
When trading with this pattern, there are two approaches for setting a stop loss. The aggressive approach is to set the stop loss just below the final bullish candle, while the conservative approach is to set the stop loss below the low of the first candle. In both cases, it is recommended to use a buffer to account for any potential volatility.
The same rule applies to the Falling Three Methods pattern. In this case, the aggressive stop loss should be set just above the final bearish candle, and the conservative stop loss should be above the high of the first candle. In both cases, it is recommended to use a buffer to account for any potential volatility.
One common strategy with the Rising Three Methods is to hold the trade until a major resistance level is reached. To increase the chances of success, traders should also look for important price barriers in higher time frames. Additionally, in intraday trading, traders should be aware of long-term market trends to help inform their decisions.
Similarly, when trading using the Falling Three Methods pattern, traders should exit the market when the price reaches a significant support level. Traders should also look for important price barriers in higher time frames and be aware of long-term market trends to help inform their decisions.
Let’s say that you are monitoring the Ethereum market, and you notice that the price has been in a downtrend for several days. You then spot the Rising Three Methods pattern forming on the chart. The first candle is a long red candle, the second candle is a short-bodied candle that opens below the previous day’s low of $200 and closes above its midpoint of $205, and the third candle is a long white candle that opens within the previous candle’s body of $205 – $210 and closes above the previous day’s high of $215.
In this scenario, one can decide to enter a long position, purchasing a call option on Ethereum, with a stop-loss set just below the low of the first candle of $195, and a profit target set at a major resistance level of $250. The price of Ethereum continues to rise, and reaches your profit target and the trade can be closed to realize a profit of $50 ($250 – $200).
On the other hand, if you notice the Falling Three Methods forming on the chart – say, the second candle is a short-bodied candle that opens above the previous day’s high of $300 and closes below its midpoint of $295, and the third candle is a long red candle that opens within the previous candle’s body of $295 – $290 and closes below the previous day’s low of $285.
In this second scenario, you can perhaps consider entering a short position, by purchasing a put option on Ethereum. Set a stop-loss set just above the high of the first candle of $305, and a profit target set at a major support level of $250. The price of Ethereum continues to fall, and reaches your profit target, you close the trade and realize a profit of $50 ($300 – $250).
Hope you’ve found this comprehensive article on the rising and falling three methods informative. For more in-depth educational guides, head on over to Delta blogs.
Q: What is the difference between Rising Three Methods and Falling Three Methods?
A: The Rising Three Methods is a bullish reversal pattern and is typically seen at the bottom of a downtrend, while Falling Three Methods is a bearish reversal pattern and is typically seen at the top of an uptrend.
Q: How can you exit a trade using these patterns?
A: To exit a trade using these patterns, traders typically set a stop-loss or a profit target, or wait for the next bullish/bearish reversal pattern to form.
Stay Connected With News, Updates And More
