For any queries, email us at [email protected]


For any queries, email us at [email protected]


For any queries, email us at
[email protected]
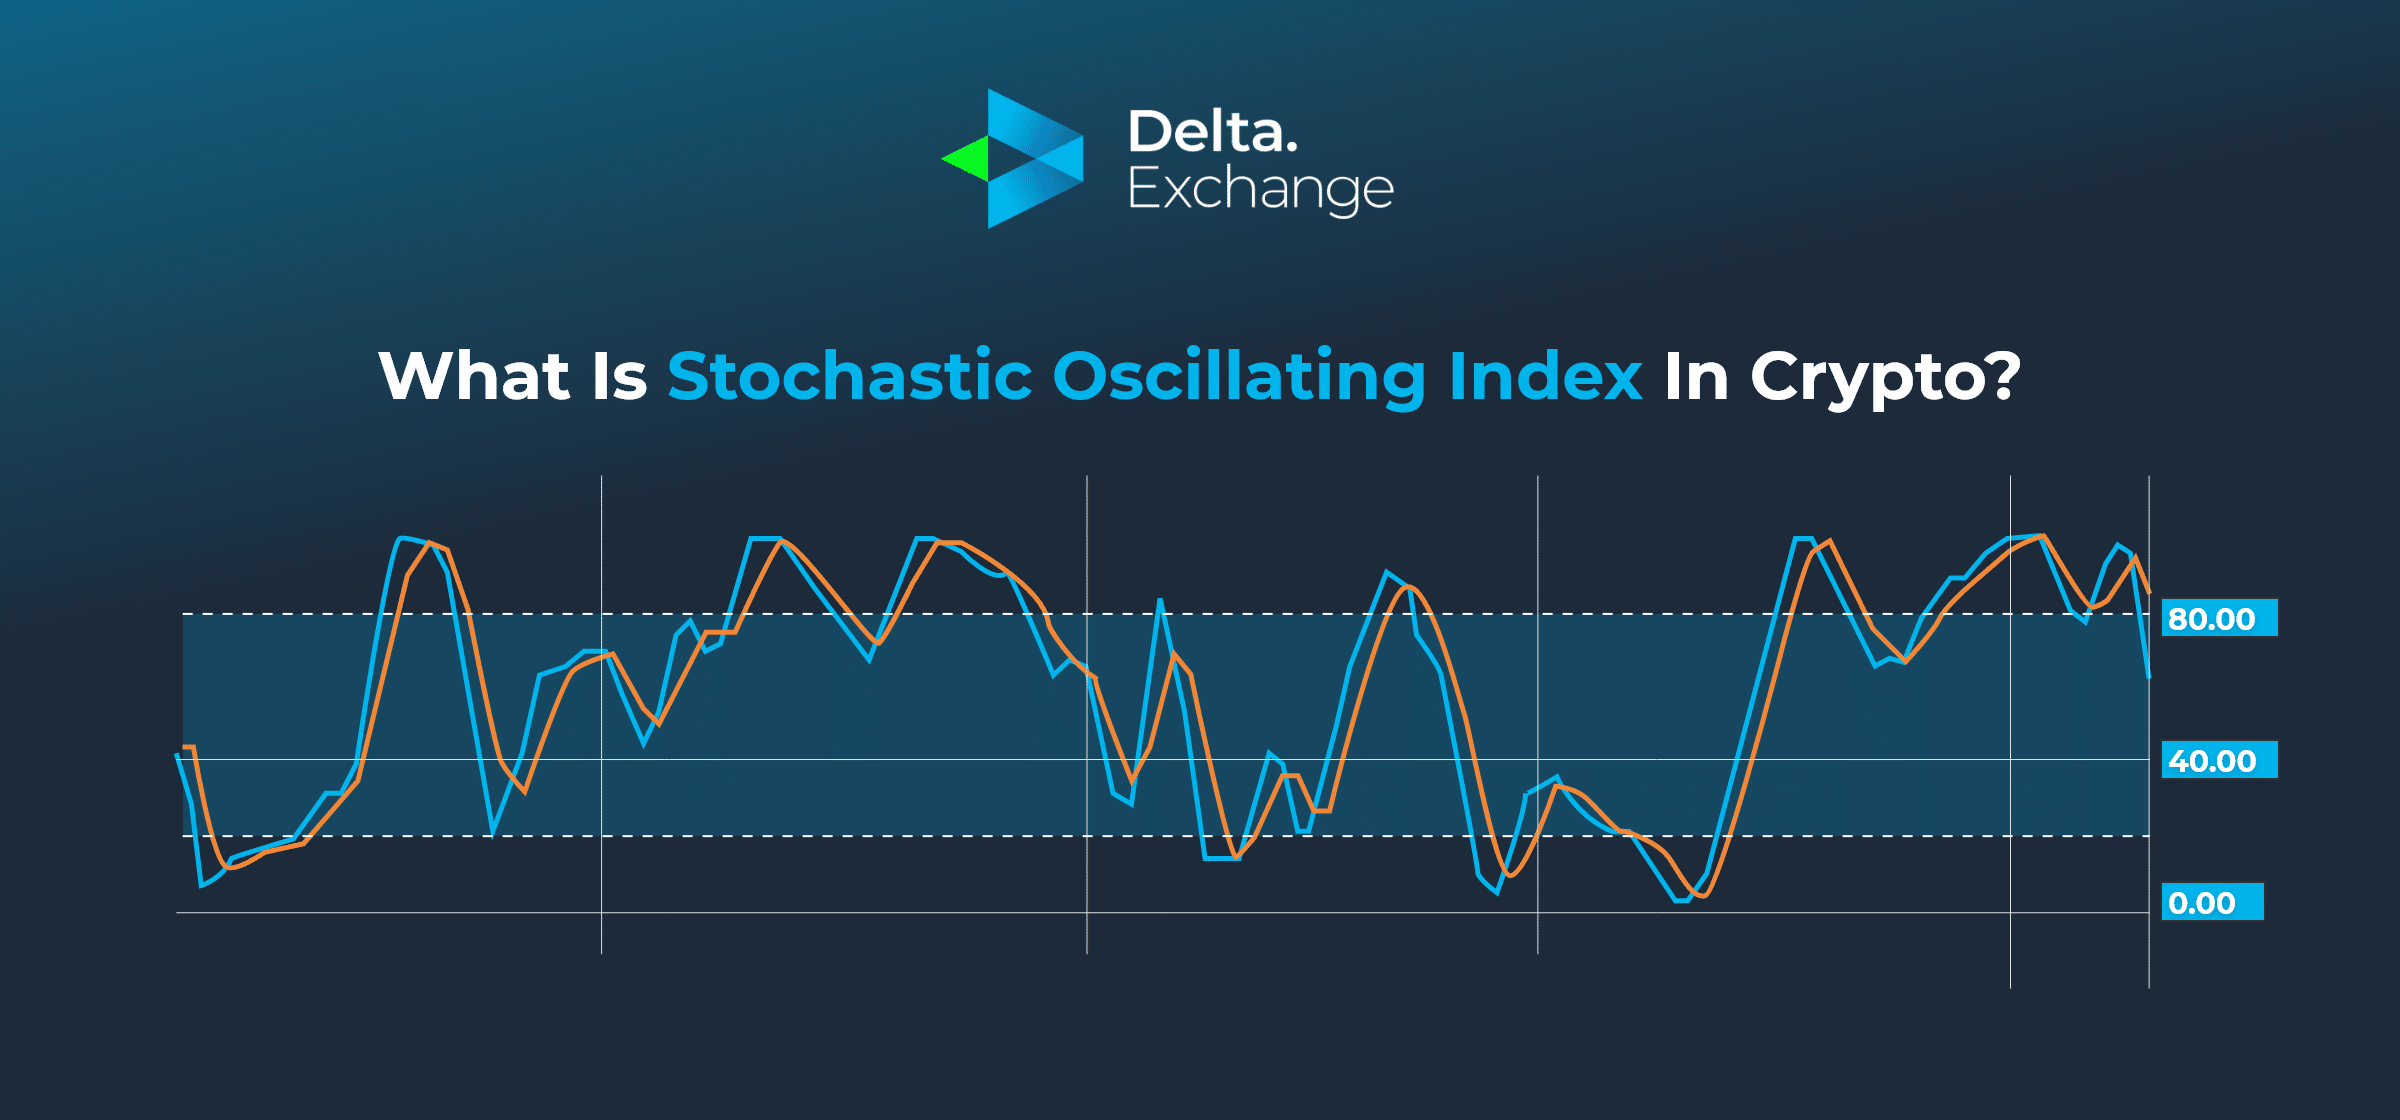

The Stochastic Oscillator is a technical indicator used to generate overbought and oversold signals, and can also be used to identify bullish and bearish divergences. In this detailed article, let us go in detail about this powerful indicator, and see how you can use this to successfully make profits in crypto futures, even during harsh crypto winters.
Typically, in practical scenarios – the Stochastic Oscillating Index, is used in tandem with the RSI (Relative Strength Index) indicator to get useful signals. Let’s understand stochastic crypto trading!
What's in this post
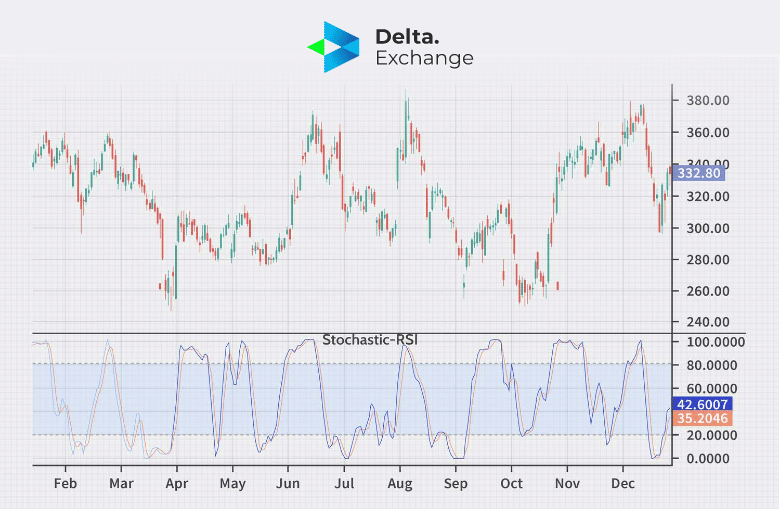
The Stochastic RSI is a momentum oscillator that measures the level of the RSI relative to its range over a given period of time. The RSI is a commonly used indicator that compares the magnitude of recent gains to recent losses in order to determine overbought and oversold conditions in the market.
The Stochastic RSI takes this a step further by applying the stochastic formula (discussed below) to the RSI values, rather than to the price data. This gives us an indicator that oscillates between 0 and 100 and is designed to identify overbought and oversold conditions in the RSI.
When the Stochastic RSI is above 80, it is considered overbought and indicates that the RSI is at a relatively high level compared to its recent range. This can be seen as a bearish signal, suggesting that the market may be due for a pullback or correction.
On the other hand, when the Stochastic RSI falls below 20, it is considered oversold, indicating that the RSI is at a relatively low level compared to its recent range. This can be seen as a bullish signal, suggesting that the market may be due for a rally or rebound.
The formula for the Stochastic Oscillator is:
%K = (Current Close – Lowest Low) / (Highest High – Lowest Low) * 100
%D = 3-day SMA of %K
Where:
The formula for the Stochastic RSI is:
%K = (RSI – Lowest Low RSI) / (Highest High RSI – Lowest Low RSI) * 100
Where:
Advanced traders sometimes alter the period chosen, and the type of moving average to suit their requirement better.
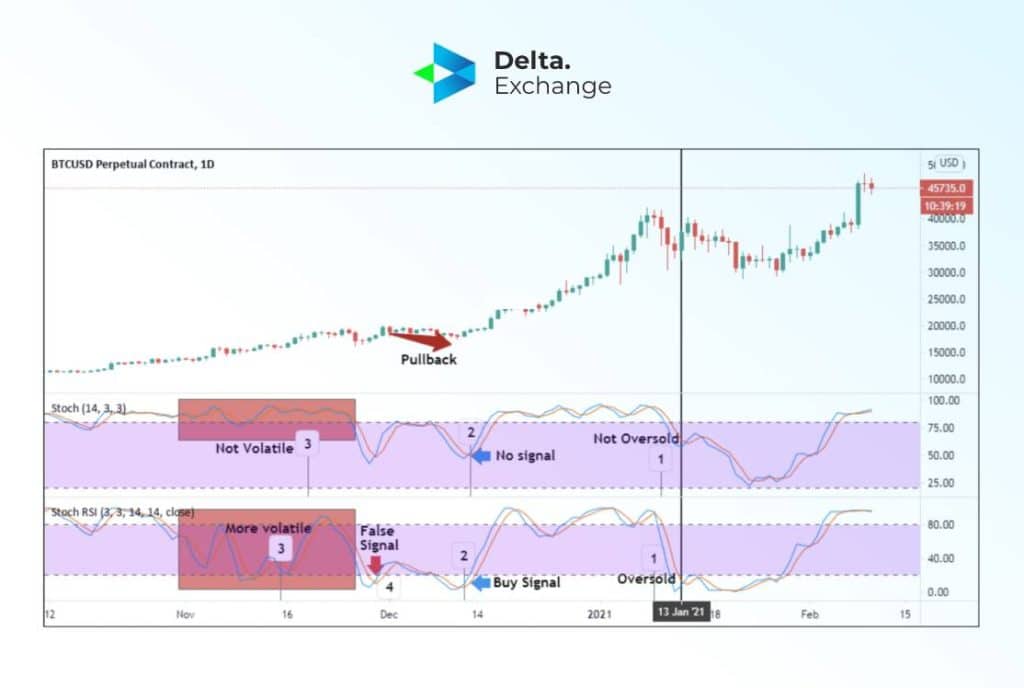
The main difference between the Stochastic Oscillator and the Stochastic RSI is the type of data that each indicator uses to generate its signals.
The Stochastic Oscillator is a momentum indicator that compares the closing price of a cryptocurrency to its price range over a given period of time. It is calculated by taking the difference between the current close and the lowest low over the given period, divided by the difference between the highest high and the lowest low over the same period. The result is then multiplied by 100 to give a value between 0 and 100.
On the other hand, the Stochastic RSI is also a momentum indicator but it compares the level of the RSI to its range over a given period of time. The RSI is a commonly used indicator that compares the magnitude of recent gains to recent losses in order to determine overbought and oversold conditions in the market. The Stochastic RSI is calculated by applying the stochastic formula to the RSI values, rather than to the price data.
Another main difference is that the Stochastic RSI is usually displayed as a single line on a chart, while the Stochastic Oscillator is usually displayed as two lines, the %K line and the %D line, which are used to generate overbought and oversold signals.
Both indicators can be used to identify overbought and oversold conditions in the market and generate signals for potential trade opportunities in stochastic crypto trading. However, they use different types of data to generate these signals, and the Stochastic RSI is considered as a more advanced version of the Stochastic Oscillator.
The Stochastic RSI can be used to trade in crypto futures in several ways:
The Stochastic RSI can be used in combination with other technical indicators to increase the accuracy of trade signals, but it’s important to keep in mind that stochastic crypto trading involves a momentum oscillator and may not be suitable for all markets.
If you’re interested in learning more about crypto trading, the Delta blog is a great resource. Over here, you will have access to the most up-to-date information and strategies for successful trading.
Q: What is the optimal period to use for the Stochastic RSI?
A: The period used for the Stochastic RSI can vary depending on the market and the trader’s preferences. Common periods used are 14 periods, but it can be adjusted to suit the trader’s needs. It’s important to note that different periods may work better in different markets and time frames.
Q: Can I use the Stochastic crypto trading in the short-term?
A: Yes, the Stochastic RSI can be used for short-term trading. The indicator can be used to generate signals for potential trades in various time frames, including short-term trades.

What if you sold an ETH straddle daily for six months (June 2023 to Jan 2024)? How would your capital have grown? What levels of risk would you have been exposed to? Description of Trading Strategy Underlying Asset: ETHEREUM (ETH) Strategy Type: Daily ATM Straddle Selling (A straddle simultaneously

In this particularly harsh crypto winter, if you’re looking for signals for the winds (so to speak) to change – Morning Star Pattern is what you’re on the lookout for. The Morning Star pattern is a bullish reversal pattern that can be found in candle charts, particularly in the stock and

One of the commonly fielded requests here has always been about ways to enter/exit the crypto market. Crypto can be overwhelming, and an indicator telling you when to enter or exit can be quite a good starting point. In this article, we discuss an indicator which would help you determine what posit

Technical analysis is something most seasoned crypto traders rely on to figure out the best possible opportunities for trade in the future. Instruments of technical analysis- better known as technical indicators, take into account factors like market history, past trends, and trader sentiments to is
Stay Connected With News, Updates And More
