For any queries, email us at [email protected]


For any queries, email us at [email protected]


For any queries, email us at
[email protected]

What's in this post
If you’ve been in the know about crypto trading over the past few years, ‘technical analysis indicators’ is probably a phrase you’ve heard being thrown around quite a lot. Technical indicators in crypto trading are tools used by traders that analyze a crypto’s price, trading volume, and interest rates. These indicators then predict the future of a crypto’s price patterns to identify the best trading opportunities and crypto trading signals – both short and long-term.
With the vast range of technical indicators available out there, choosing the right one for you might seem like a daunting task. While you’d have to be the one to make the ultimate decision based on your trading goals, here we have compiled a list of some of the best known and broadly used technical indicators out there to help you out!
This technical indicator, as it name suggests, is used to measure the momentum in the price changes of a particular cryptocurrency. A singular line on a chart constitutes the momentum indicator, so traders can figure out how quickly a cryptocurrency’s price is fluctuating by monitoring the readings. The higher the chart reading soars over 100, the faster the cryptocurrency’s price rises. Alternatively, the rate at which the reading falls below 100 is the same at which the cryptocurrency’s price is also going down.
The momentum indicator is a very useful trading indicator, generally used for short-term analyses by traders who aim to enter into crypto trades when the market volatility is high and leave when the momentum begins to fade.
One of the simplest and most used technical indicators, RSI, is one kind of momentum indicator that charts the frequency with which cryptocurrency’s prices rise or fall along with the prices themselves.
The indicator moves between the ranges of 0 and 100, with the data being displayed on a line chart. When the RSI value stands at 30 or lower, it meansthe cryptocurrency has been oversold, therefore indicating the possibility of a buying opportunity. On the flip-side, if the RSI is 70 or more, the cryptocurrency is deemed overbought.
Since RSI provides an easy-to-understand representation of cryptocurrency price conditions, it has proven to be plenty useful for all sorts of traders: from beginners to experienced ones.
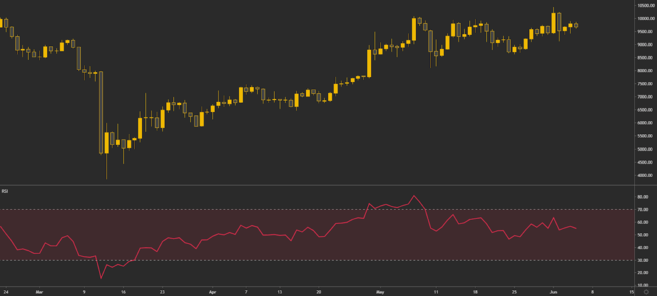 The RSI indicator on a Bitcoin price chart | Source: Binance
The Bollinger Bands, named after John Bollinger, is a trading indicator that measures market volatility. The indicator is represented by three bands – or lines – on a chart. The middle band represents the price of a crypto asset, sandwiched between the upper and lower bands. Now, the closer the middle band is to the upper band, the nearer the crypto is to being considered overbought. Likewise, the closer the middle band is to the lower band, the nearer the crypto is to being oversold.
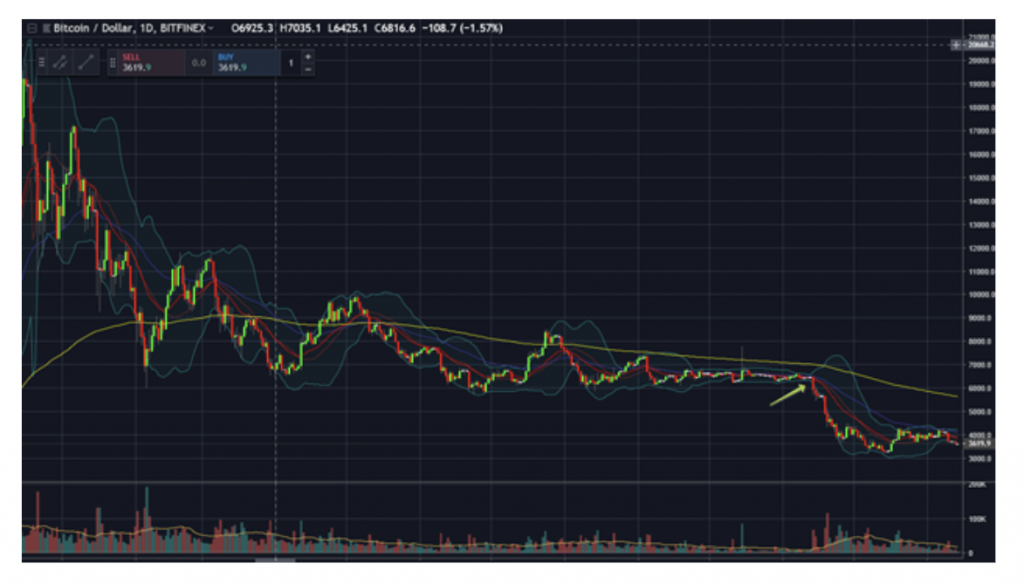 Bollinger Bands representing the price volatility on a Bitcoin chart | Source: Bitcoin.com
The Bollinger Bands Squeeze is a strategy a lot of cryptocurrency traders aim to benefit from. When the bands are really close to each other, the crypto’s value gets ‘squeezed’ into a narrow scope, leading to the pressure building up within that small reach. The market bursts out of the squeeze sooner or later, which prompts a period of high volatility. However, it’s true that the market can head either upwards or downwards, making the Bollinger Bands Squeeze strategy out to be a neutral one.
The trading volume exhibits how much a crypto asset has been traded within a particular time period. By assessing the trading volume, crypto traders can have notions as to how powerful the underlying trend is. If there’s high trading activity, it should give way to a sizable trading volume, which in turn might indicate high market volatility; of course, the price of a cryptocurrency can move either upwards or downwards.
If a massive price shift comes right after a high trading volume, that would positively leverage the trading volume indicator.
The Fibonacci Retracement is a trading indicator rooted in the concept of the Fibonacci numbers – a series of numbers where each digit is the sum of the two that come right before (for example: …, 2, 3, 5, 8, 13, 21, … …). When it comes to the trading indicator, there are Fibonacci retracement levels represented by horizontal lines, where each level symbolizes a Fibonacci figure as a percentage.
The percentages, when put on a chart, can show plausible support and resistance zones. A cryptocurrency trader might pick two points of their choice on a chart, then mark them as levels 0 and 100, respectively, on the Fibonacci retracement indicator. Now the levels in between pointed out by the indicator would show probable entry and exit points, as well as display the stop loss order.
The Fibonacci percentages used on the retracement levels are 0%, 23.6%, 38.2%, 61.8%, 78.6% and 100%. The 50% mark is also counted in by many cryptocurrency traders, even though 50 is not a traditional Fibonacci number. Sometimes Fibonacci percentages below 0 or above 100 may also get used, like 261.8% or 423.6%. Check out this in-depth, dedicated guide to Fibonacci Retracement in crypto trading.
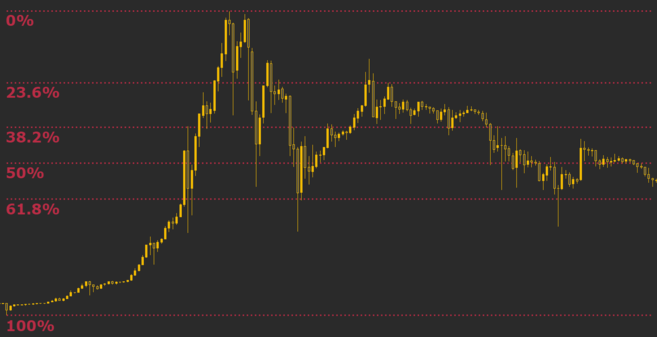 Fibonacci levels put on a Bitcoin chart | Source: Binance
A moving average, or MA, is another technical indicator that makes the price trends stand out by erasing out the random, short-term price shifts within a certain period of time.
A moving average can be determined through multiple methods, the two most used ones being the simple moving average or the SMA, and the exponential moving average or the EMA. While both identify market trends by analyzing past data, there’s a difference between the systems used.
SMA is produced by summing up the closing prices of certain cryptocurrencies within determined periods of time, then dividing that sum by said number of time periods. Therefore the SMA can provide information on the market trends for any stretch of time you please. The EMA, on the other hand, takes only the latest price data into consideration, which means it’s not as flexible as the SMA.
The MACD is a trading indicator that makes use of the exponential moving average formula; what it does is show the market momentum by utilizing two moving averages of a crypto’s value.
The MACD indicator is formed with two lines- one the MACD line and the other the signal line – and traders can estimate the momentum of the market by keeping track of the relationship between the two lines. If the MACD line rises above the signal line, it symbolizes rising prices; and if the MACD line goes under the signal line, it represents falling prices.
The Ichimoku Cloud is a fairly complex trading indicator that merges some other trading indicators. Even though the process is complicated, if used right, the Ichimoku Cloud is capable of generating very definite trading signals.
The Ichimoku Cloud is another moving average centered trading indicator. It calculates five past averages and marks them on a cryptocurrency’s chart. The cloud itself is also a part of the trading indicator; when the price is below the cloud, the trend is pointing down, but it signals an uptrend when the price is above the cloud. The Ichimoku Cloud provides a comprehensive report of past market trends, market momentum, and support and resistance price levels.
The parabolic SAR is a trading indicator that signals the future short-term momentum of a particular crypto asset. The indicator turns up on a crypto chart as a series of dots above or below its price, based on the crypto’s momentum. When a dot appears below the price, it symbolizes an uptrend. Similarly, when a dot is over the price, it signals a downward trend. Transaction signals are produced when the dot changes sides.
The parabolic SAR can ascertain the direction of the market trend and point out potential trend reversals. The best use of a parabolic SAR can be made at the time of strong market trends.
The VWAP indicates the average price of a particular cryptocurrency throughout the trades that occur within a given period of time, based on trading volume and price.
On a crypto chart, when the market price is above the VWAP line, it symbolizes rising prices. And of course, the reversal of positions suggests falling market prices of the crypto. In some ways, VWAP is very similar to how the moving average indicator functions; however, the primary difference between the two is that VWAP combines the study of the trading volumes with the shifting prices, while the moving average method just considers the average prices.
VWAP allows an understanding of both the market trends and changing values of a cryptocurrency, along with specifying liquidity levels.
While technical indicators are obviously not a mandatory requirement for successful cryptocurrency trading, it’s undeniable that they offer valuable guidance when it comes to assessing crypto markets and figuring out where you’d want to invest for the best returns. This is especially true when trading cryptocurrency derivatives such as crypto futures or options. Most cryptocurrency exchange platforms – like Delta – let users utilize many technical indicators, including the ones we mentioned above. If you are a crypto trader looking for beneficial long or short-term trading opportunities, it’d be in your best interests to leverage a technical indicator of your choice.
Stay Connected With News, Updates And More
