For any queries, email us at [email protected]


For any queries, email us at [email protected]


For any queries, email us at
[email protected]
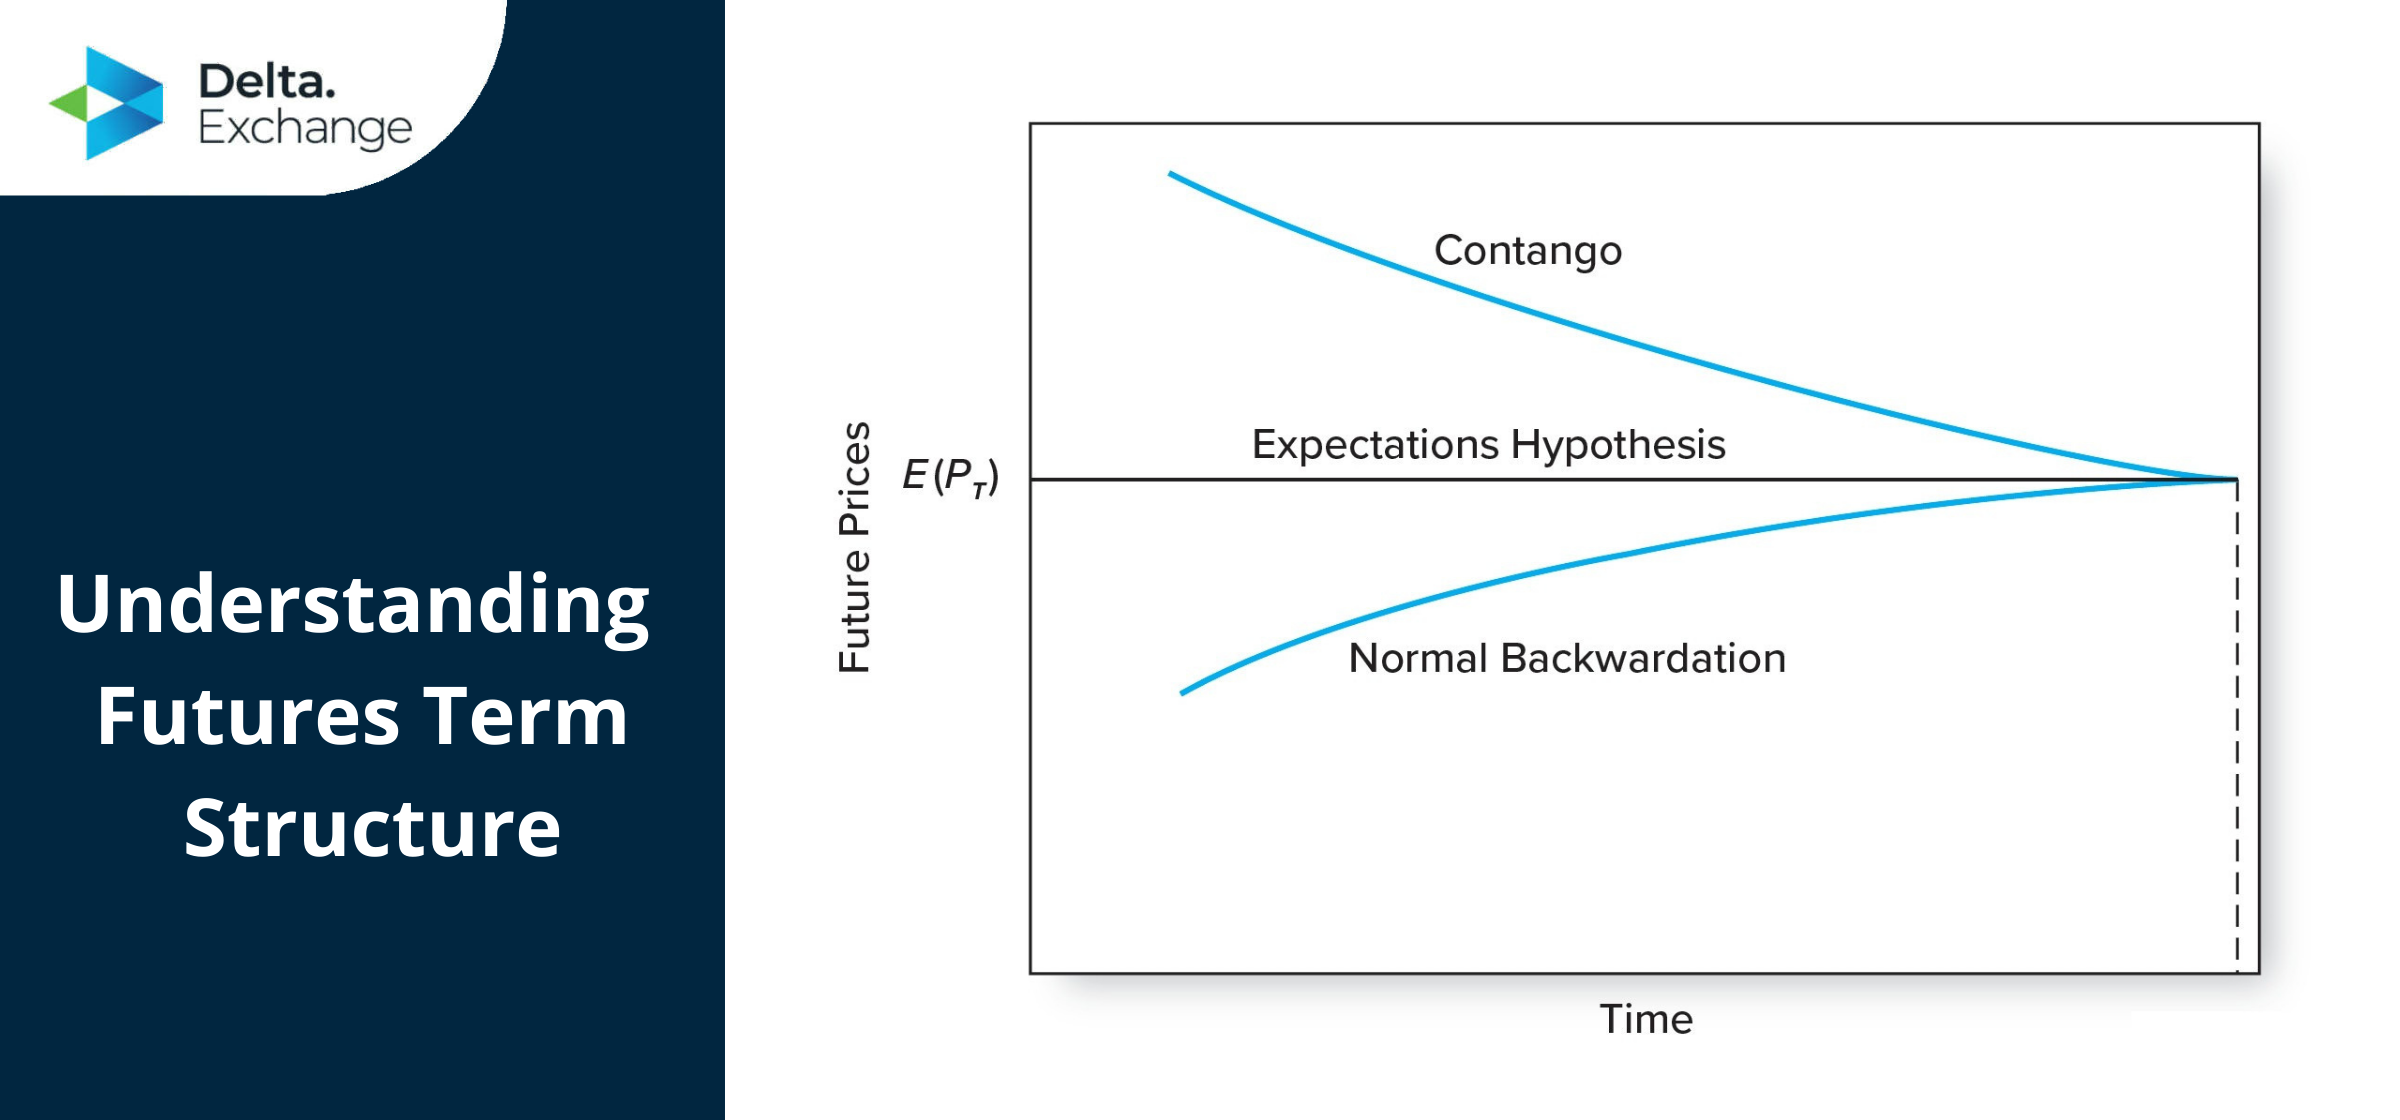

Futures term structure is the price curve formed by the price of the futures contract over the different expiration months. Usually, futures are offered across multiple expiration months at a different price for each asset. When you take a graph and plot these points together, you get a price curve, referred to as the term structure of the underlying assets.
The curve formed by the term structure of futures contracts can be extremely crucial in analyzing the supply and demand of the product, and the associated price changes, by extension. The Futures term structure often occurs in two different shapes – called the normal market curve, and the inverted market curve, and these two terms are often confused with Contango and Backwardation, even by people in the know. Let’s take a look at the types of curves, and understand how to take advantage of them when trading crypto derivatives – like Bitcoin futures, Bitcoin options, and the like.
What's in this post
A normal market curve is a futures term structure where the prices rise with the increase in the duration of expiry, forming a positive curve (rises as it goes away from the origin). This is the most common structure for commodities, as the rising prices indicate an increase in storage costs with the longer delivery period. This curve signals that there is no severe shortage in the supply, or demand of a product. The steepness of this curve can indicate volatility in the coming months.
An inverted market curve will see the prices going down with an increase in the expiration period, forming a negative curve (lowers as it goes away from the origin). Inverted market curves are extremely common in financial futures, such as the BTC USD futures. This can be attributed to the 0 storage costs involved, due to the lack of a physical product to be delivered.
Contango is the situation that occurs when the futures price is above the expected future spot price. To best explain contango, consider a futures contract valued at USD 60 presently, with an expiry of a year. As time passes on if the same contract is valued at USD 50, then this situation is called Contango. This means that with the passage of time, the price of the futures is expected to drop, and should be treated accordingly. This is because the price of the futures must decrease to converge on the expected price of the futures. (They must converge on maturity as if otherwise, it’s easy for everyone to make free money with arbitrage, explained later).
When in contango, a trader would place a spread trade, shorting the spot month while buying further out, to profit off a contango.
Backwardation, the opposite of Contango, is the situation when the expected futures spot price is above the price of the futures. As time goes on, the value of the same futures is expected to increase, with the passage of time. Going by the same example, the price of the futures could rise to USD 70, signaling backwardation.
Profiting off Backwardation is fairly simple, placing a spread trade, going long as soon as possible while selling close to the date of expiry.
Cash and carry trades are an effective trading strategy, which takes advantage of the pricing discrepancies, identified on an underlying asset, presenting an opportunity for arbitrage. Investors purchase the asset and sell futures simultaneously (long on the asset, short on the futures), provided that purchase price plus associated costs are less than the price of the futures sold.
This does sound a bit complicated, so allow us to break it down with an example.
Imagine you’ve found an asset worth $50 in the market, while the futures are priced at $55 for a month. The associated costs come up to $3, and regardless of the movement in the price of the asset over the month (say the price goes down to $40), you’d still stand to gain $2 on the transaction when you deliver the asset in a month (total costs $53, price of futures $55).

What if you sold an ETH straddle daily for six months (June 2023 to Jan 2024)? How would your capital have grown? What levels of risk would you have been exposed to? Description of Trading Strategy Underlying Asset: ETHEREUM (ETH) Strategy Type: Daily ATM Straddle Selling (A straddle simultaneously
With India going under Covid-19 induced lockdown at the beginning of 2020, the crypto trading volume in India has grown significantly. Ever since the Supreme Court of India ruled in favor of cryptocurrencies in March, 2020, lifting the crypto ban in India previously imposed by the RBI (Reserve Bank
Haven’t we all tried reading charts as amateurs? Trying to decipher a pattern and noticing that unmistakable wave of sorts when an asset rises, or even when it falls? Whether we understand technical analysis or not, if we’ve tried our hand at trading any asset – whether conventional or cry

If you have engaged in trading stocks or trading cryptocurrencies by attempting to predict price movements using technical analysis, you’re probably familiar with the terms support, resistance, and trendlines. However, if you’re just beginning out using technical analysis to trade in crypto deri
Stay Connected With News, Updates And More
