For any queries, email us at [email protected]


For any queries, email us at [email protected]


For any queries, email us at
[email protected]

Trading with assets like cryptocurrencies and assets requires basic Technical Analysis(TA). Among these, double top and double bottom patterns are important trend reversal indicators that could possibly change the flow of an asset’s price action.
Double top and Double bottom patterns are common market trend indicators that are easy to identify. Just like other trading patterns, these indicators symbolize traders
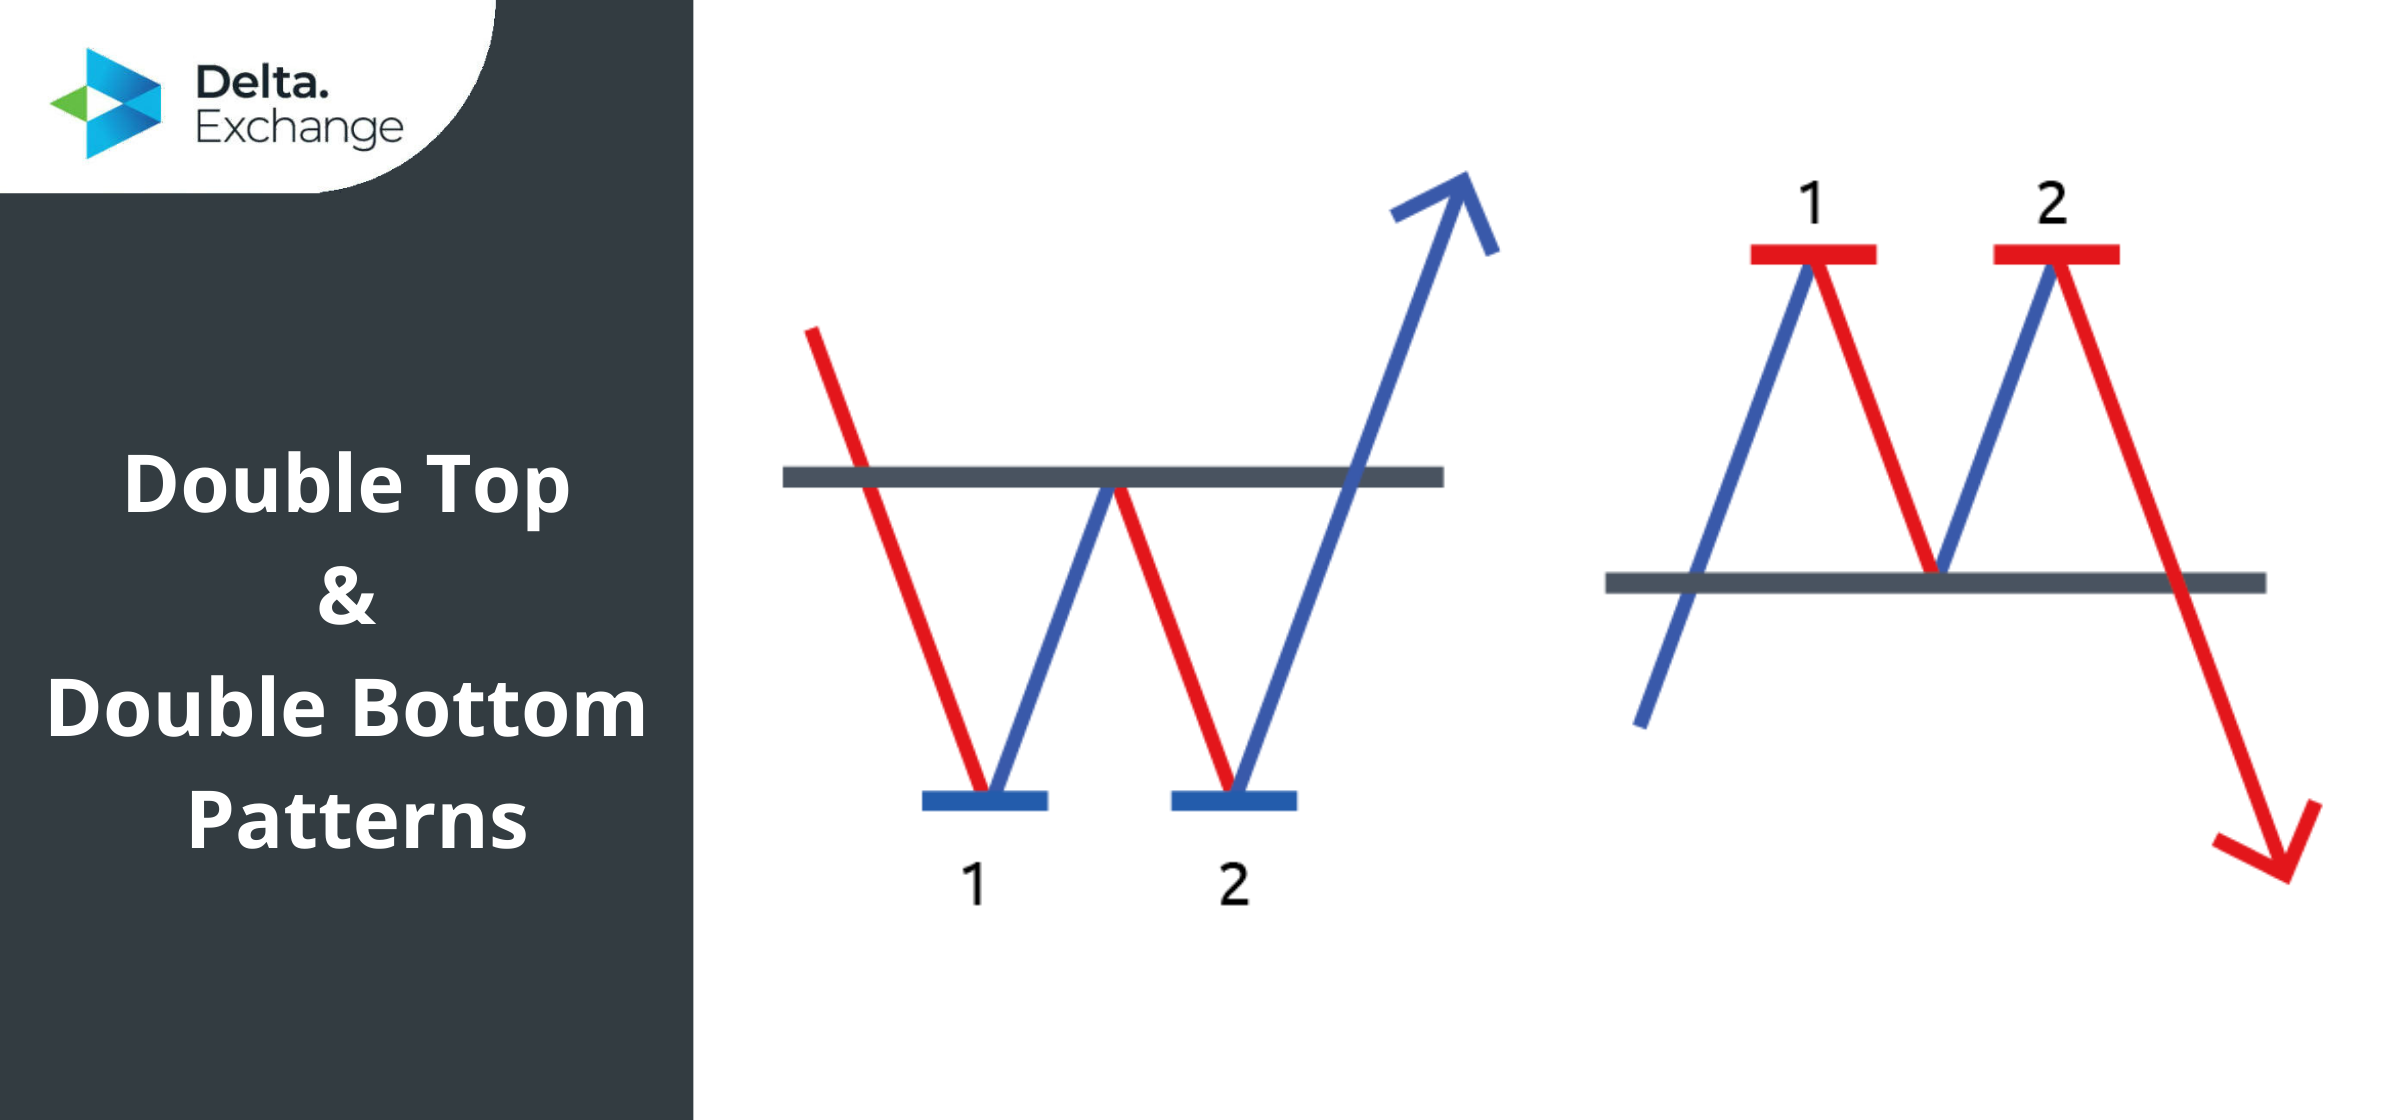
collective sentiments. Double top and Double bottom generally make clear ‘M’ or a ‘W’ shaped formation indicating retesting of temporary extremes. These patterns are usually supplementary indicators used in conjunction with other Technical indicators to avoid fakeouts and mistakes in predicting price action.
To understand these patterns clearly, below is a complete guide on what they are, how to identify them, and how to trade Bitcoin under such conditions.
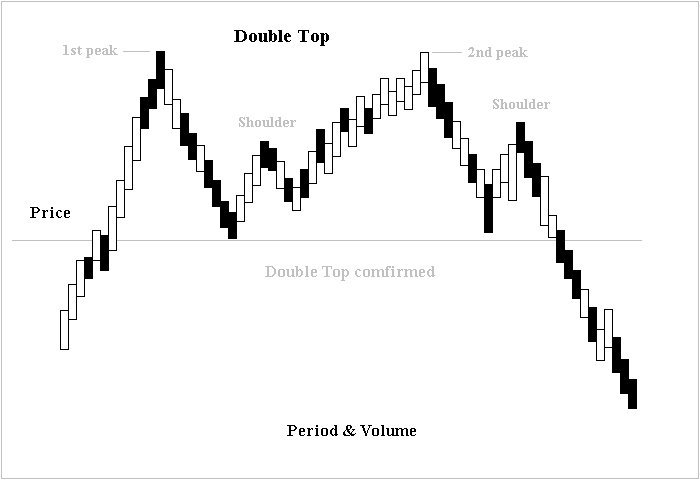
A double top pattern is formed when two consecutive rounding tops are created, making an ‘ M ‘ shaped pattern. A double top is a bearish reversal indicator, which can generally be seen after an extended bull run. The first top looks like a ‘U’ turned upside down, which bounces off from the neckline where it tries to make another ‘U’ shaped pattern, thus completing the ‘W’ shaped pattern.
Generally, the second top is slightly lower than the first one indicating buying exhaustion and early resistance. Indicating a bearish
This time, the price action will break the neckline support and decline further.
Check out the condition of the market; a double top usually is not a fakeout when the market is at the end of the bull run.
After checking the market condition, traders should identify a double top pattern and note the neckline and size of the tops.
Sometimes, the price action can retest after breaking out from the “support turned resistance” traders can also open a short position at the support while the price action is retesting.
A double top is generally a fakeout in smaller time frames (lower than one hour) and hence should be avoided. If there is a long time and space between the two tops, it is probably a double top.
In a strong market uptrend, a double top could probably be a fakeout, therefore, avoid a short position from the top.
Always use Dollar Cost Averaging(DCA) since there is a certain degree of volatility involved when trading with assets like Cryptocurrencies, Stocks, and Forex.
Bitcoin traders should only enter a short position after it breaks out of the trendline to avoid loss or liquidation in the event of a fakeout.
A stop loss should always be kept just above the first local resistance above the neckline.
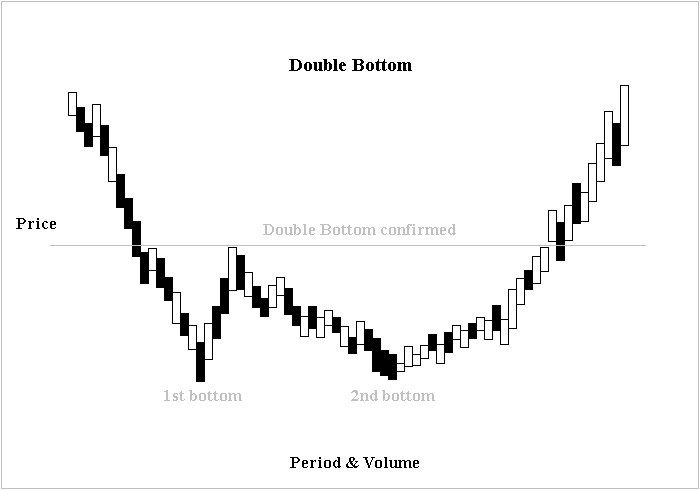
A double bottom is exactly the opposite of the above-mentioned double top pattern. A double top pattern is a technical analysis charting pattern that indicates a trend reversal in Bitcoin’s price action. When Bitcoin traders spot a double bottom pattern, they can safely anticipate a bullish price action. A double bottom is formed by the first bottom or ‘U’ followed by another bearish rebound on similar levels, collectively making a ‘W’ pattern.
A breakout occurs only when the rice rejection starts from ( somewhat) similar levels in a double bottom pattern, making that price level resistance. So a trend reversal can only be expected after the breakout from the neckline ( support); before that, a double bottom could be fake.
Just like the double top, the double bottom is also generally used in supplementary with other indicators.
Double bottom is generally not a fakeout when the market is in a bullish or bullish crossover mode.
Enter in a long position or buy that asset only if you see a sudden increase in trading volumes before the breakout.
Only enter after a confirmed breakout.
In case you didn’t get an entry, you can get a second chance to enter if the price action retests from the neckline support turned resistance
Do not enter in a double bottom position made in smaller time frames( less than an hour). They are usually fakeouts or smaller pumps.
Do not enter during the end run of the second trough; it is important to confirm first.
Double bottom is a trend reversal indicator, i.e., it will change the price action of the implied asset from bearish to a bullish pattern. Apart from the TA on that asset, it is essential to check the condition of the market.
Always keep a stop loss lower than the first local support below the neckline.
Double top and double bottom are important Bitcoin trading indicators since they are trend reversal patterns. If identified and traded at the right time, they could potentially generate great profits on your Bitcoin trade. Good luck!

What if you sold an ETH straddle daily for six months (June 2023 to Jan 2024)? How would your capital have grown? What levels of risk would you have been exposed to? Description of Trading Strategy Underlying Asset: ETHEREUM (ETH) Strategy Type: Daily ATM Straddle Selling (A straddle simultaneously
What is Technical Analysis in Crypto Trading? The cryptocurrency market being exceptionally unpredictable and volatile, traders need concrete strategies to go about trading their assets. Technical analysis, or TA, and fundamental analysis, or FA, are two of the tools traders most commonly use to for
Cryptocurrencies have become two widely popular means of investment in 2020. As new traders enter the market and experienced ones continue to learn new lessons, it is important to understand how trading itself works. Investors usually analyze stocks and the cryptocurrencies, and other assets based o
What is a Technical Indicator in Crypto Trading? If you’ve been in the know about crypto trading over the past few years, ‘technical analysis indicators’ is probably a phrase you’ve heard being thrown around quite a lot. Technical indicators in crypto trading are tools used by traders that a
Stay Connected With News, Updates And More
