For any queries, email us at [email protected]


For any queries, email us at [email protected]


For any queries, email us at
[email protected]
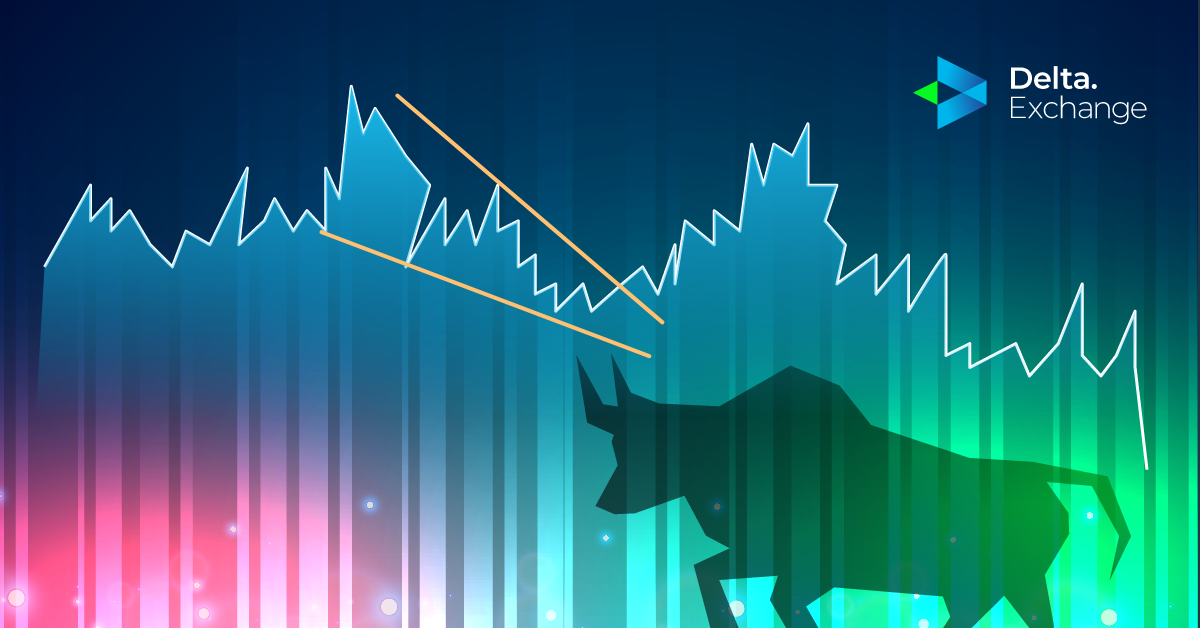

A crypto trader is more likely to succeed if they buy an asset from a logical position than randomly buying an asset without proper thought and analysis. Technical analysis can be a great way to analyze and assess the markets before making your next buying decision. A falling wedge pattern is an important technical analysis tool that traders should keep on their checklist.
In a falling wedge pattern, a bullish price pattern depicts the trend or story about the market in which the bulls prepare for another push. Keeping a falling wedge pattern as our trading pattern is a beneficial method to make money in the crypto market.
What's in this post
The falling wedge pattern is bullish in nature and appears after a bearish trend. The pattern indicates that the bulls have lost their momentum, and bears have taken over the price temporarily. As such, the price hits lower lows but at a corrective speed.
Like all other assets, crypto prices tend to move in a zigzag pattern, with swings between highs and lows. They rarely move in a straight line. Thus, traders experience a temporary bearish correction within bullish trends, which gives rise to patterns like the wedge, triangle, flag or channel.
These are signs that purchasing pressures have been reduced to profit-taking. The falling wedge pattern can produce a higher trade accuracy than a conventional descending channel.
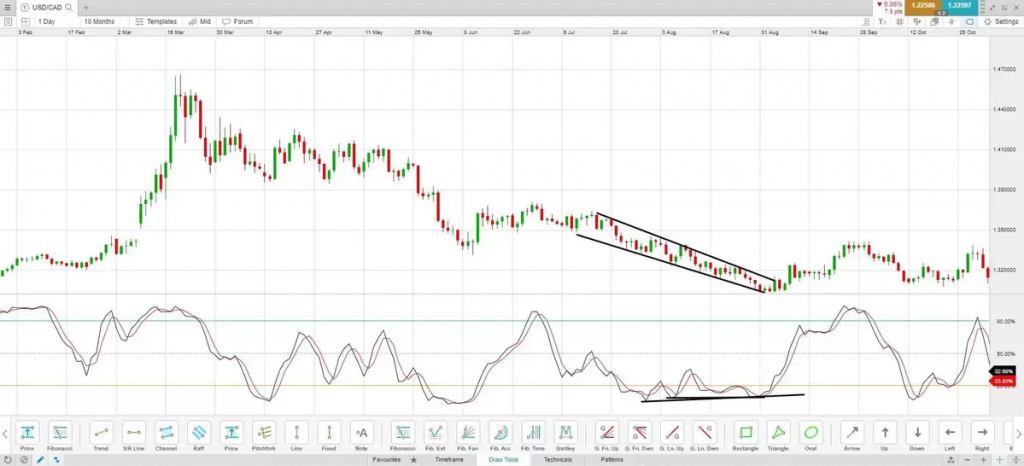
Source: Daily FX
The depicted patterns, descending channel and falling wedge, are bullish reversal patterns. The falling wedge has better accuracy than descending channels. The price of descending channels corrects by keeping an equal distance between swing highs and lows. However, the swing levels squeeze towards one another on the falling wedge, depicting deeper correction.
Before making a trading decision, investors should consider the present trends and the performance of volumes.
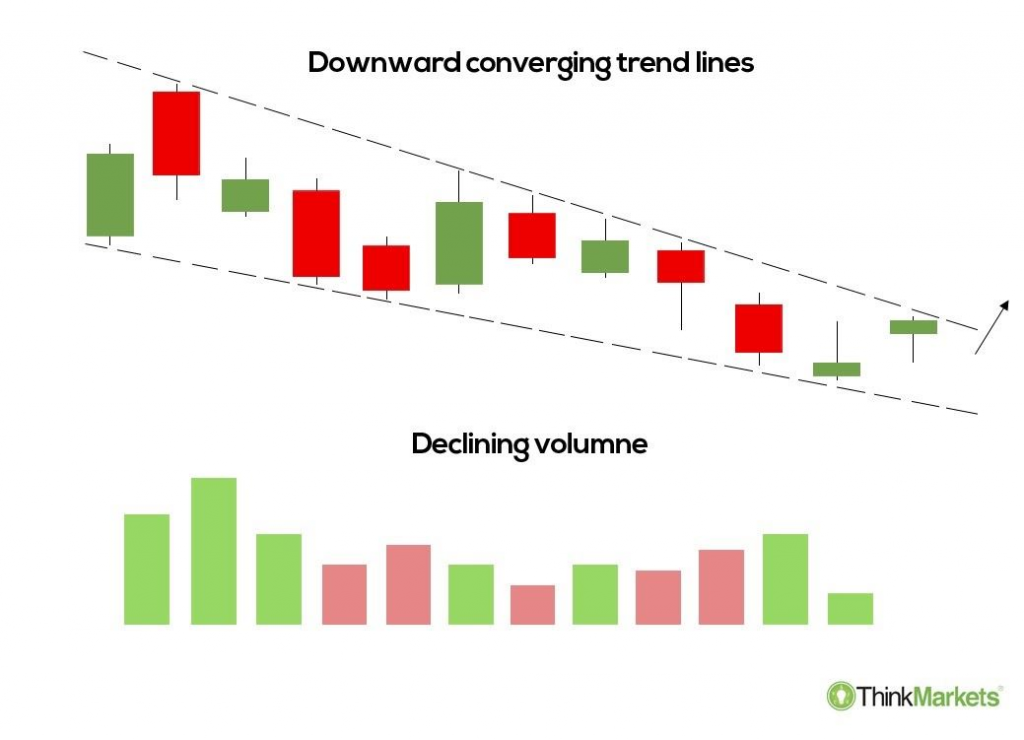
Source: Think Markets
The falling wedge pattern offers a lucrative methodology to investors to earn profits. However, there are some downsides to it too.
The advantages of the falling wedge pattern are:
The disadvantages of the falling-wedge pattern are:
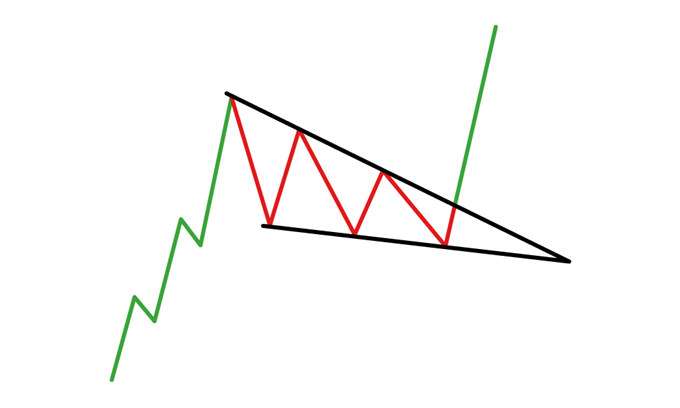
Price patterns aren’t random formations; they represent a story about the buyers’ and sellers’ activity in the market. The falling wedge pattern appears after a bearish trend. They indicate a narrative about the behaviour of the bulls and bears and what their next possible move would be.
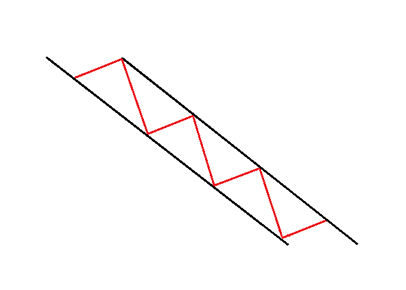
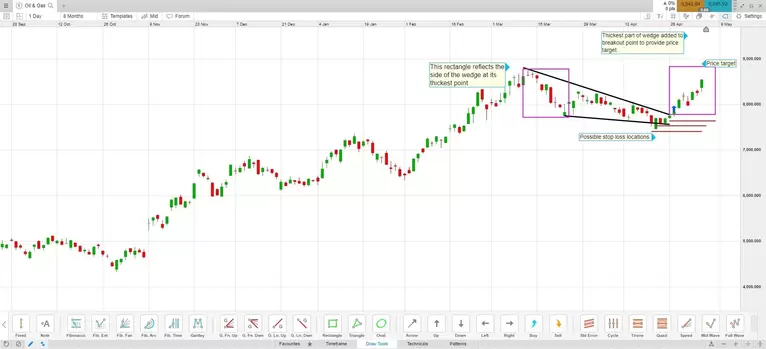
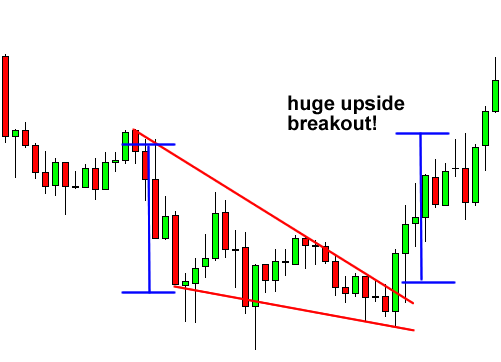
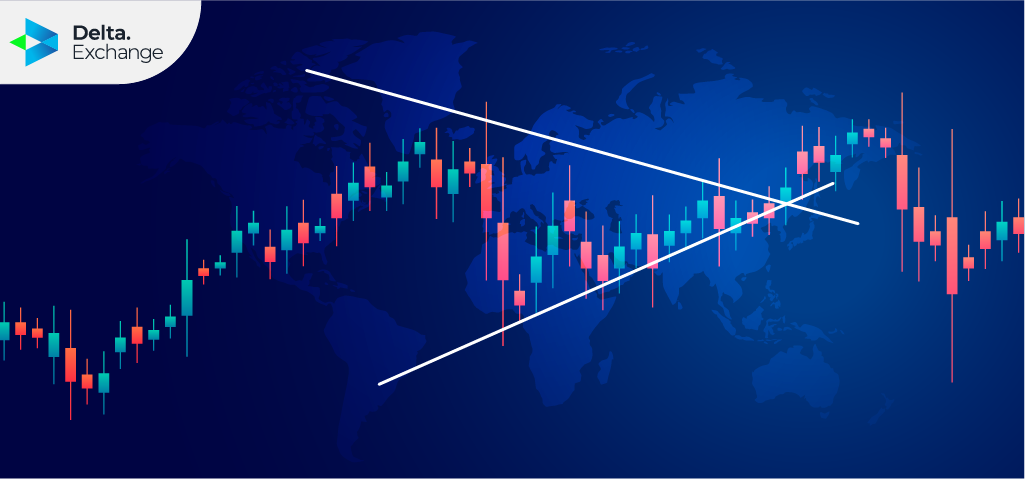
A falling wedge formation occurs when two downward sloping trendlines appear to converge on the price chart representing the price squeeze, followed by a possible breakout. The trendline pair can be formed by joining lower highs and lower lows occurring during the given time period.
Underlying dynamics of falling wedge pattern: A bullish trend is formed after an event that encourages buyers to purchase a cryptocurrency with hopes of price appreciation. After getting a benefit, they usually book a profit, which often adds more positions when the prices are discounted. The bearish wedge pattern that appears after the bullish one results from buyers’ taking the profit. Once this process of profit-taking ends and the price drops, investors and traders start buying again.
The approach is to find when corrections are over and the bullish trend is likely to resume. Traders in the global finance market need liquidity. There have to be enough sellers to buy and enough buyers to sell. The falling wedge pattern indicates that institutional traders who created the bullish trend might open another position for buying, resuming the trend after a discount.
Source: CoinMarketCap
Besides swing levels, investors must monitor the changes in volumes as well. The volume will reduce due to less activity in trading as the price will move to a consolidation phase. A higher volume should support it once the breakout occurs.
Source: CoinMarketCap
Determining a trading strategy is a quotient of how the price performs following a breakout and the degree of risk a trader wishes to bear. However, a general strategy for trading a falling wedge pattern could be as follows:
A falling wedge reversal pattern from a significant price level provides more profits in cryptocurrency trading than in traditional markets. It is important to find the right patterns from ideal locations for this to happen.
These patterns indicate bears losing momentum as they appear in a swing low. If you find a falling wedge reversal pattern after a considerable price downturn, consider it more profitable. It is difficult to predict whether the bearish trends will reverse or continue. Therefore, finding the falling wedge reversal pattern at the bottom increases the probability of trend reversal.
Source: Babypips
To trade the falling wedge pattern as a market reversal strategy, we need to ensure:
Though it might be difficult to find an ideal falling wedge pattern in the perfect market conditions, the investors can apply the concepts stated in the article to find beneficial trading options. The falling wedge patterns – both continuation and reversal – are a great way to identify the reversal of trends in the market and figure out strategies before making any trades in the market or before new trends emerge.
What is a falling wedge pattern?
It is a bullish reversal pattern which appears in the swing low of downtrends.
How to confirm a falling wedge pattern?
To confirm a falling wedge pattern, there must be at least three touches at the levels of trend lines.
When does the falling wedge pattern become tradable?
The falling wedge pattern becomes tradable once the price breaks out above the resistance trendline in the pattern with a bullish candle.
When is the trading entry confirmed?
After a valid breakout and bearish correction, the trading entry is confirmed. However, the price may move higher without any retracement in some cases.
What is the ideal stop-loss approach?
The ideal stop-loss approach is to set the limit below the near-term swing low with some buffer.

What if you sold an ETH straddle daily for six months (June 2023 to Jan 2024)? How would your capital have grown? What levels of risk would you have been exposed to? Description of Trading Strategy Underlying Asset: ETHEREUM (ETH) Strategy Type: Daily ATM Straddle Selling (A straddle simultaneously

A chart pattern occurs in response to the price movements of a crypto asset that may mirror a common shape like a rectangle, triangle, head and shoulders, etc. These chart patterns present the traders with a visual way to trade. Chart patterns provide traders with several advantages, including logic
Options trading strategies consider buying and selling multiple option trading contracts simultaneously for an optimized investment position. Such strategies offer a cost-effective route to hedge against risk and profit from price speculations and future market movements. Now, crypto options are a
In the financial markets, traders use a variety of tools when performing technical analysis, (TA). These tools are necessary to help them to read and understand the previous chart movements before making analysis-based predictions of the next market movement. One of the most important tools that you
Stay Connected With News, Updates And More
