Educational
October 28, 2020
A Guide to Technical Analysis for Crypto Trading
Shubham GoyalProduct Specialist
What is Technical Analysis in Crypto Trading?
The cryptocurrency market being exceptionally unpredictable and volatile, traders need concrete strategies to go about trading their assets. Technical analysis, or TA, and fundamental analysis, or FA, are two of the tools traders most commonly use to form said strategies.
Fundamental analysis in cryptocurrency trading is projecting on a crypto’s inherent value. Technical analysis, on the other hand, is the procedure of monitoring the past movements of cryptocurrency and analyzing previous data like price volatility and volume to try and predict the future of a particular crypto, or the market overall. Initially, the TA method was applied in traditional financial markets to project on the futures of stocks and other kinds of assets, but in recent times it has also proven to be successful in the cryptocurrency markets.
While the roots of technical analysis can be found in 17th century Amsterdam and then 18th century Japan, the way TA works now can be accredited to Charles Dow, an American journalist best known as the creator of The Wall Street Journal. He was one of the first people to point out that certain market trends repeating themselves can be investigated for a notion of what the market future looks like. The Dow Theory on stock price movement is a form of TA that was later derived from his works.
Dow Theory suggests every available data has to be taken into consideration when it comes to pricing in the market. Following the same rule in crypto trading, the data considered in the TA approach includes market demands (past, current and future), trader experience with a particular crypto and individual trader expectations.
Technical Analysis vs. Fundamental Analysis:
Fundamental analysis, as mentioned before, studies factors relevant to the price of a crypto, instead of relying on past data. FA scrutinizes everything from the overall financial economy and industrial conditions to the financial strength and management techniques of individual companies. So all price specific facts – earnings, expenses, asset prices, and liabilities are evaluated by traders using fundamental analysis.
FA has a much wider range when compared to TA, since FA can be used to speculate on a particular crypto asset’s potential and ascertain whether it is overvalued or undervalued.
As opposed to FA, technical analysis analyzes historical patterns and other data to judge the strengths and weaknesses of a particular crypto. While it’s true that FA appropriates a broader approach compared to TA and puts a lot of emphasis on qualitative components, TA still analyzes all the fundamental elements related to particular crypto by investigating all market price data. Therefore, for the individual trader, technical analysis would usually prove to be the better way to go when forming a robust strategy for maximized profits.
Plus, there’s always at least a little guesswork involved in FA, but in TA, all predictions are backed by facts. In the past, TA has been known to make impeccable predictions, especially when it comes to spotting short-term trading opportunities.
How Is Technical Analysis Used?
The basic idea of technical analysis is that when it comes to crypto pricing and trends, history repeats itself. Therefore, the price movements are very rarely random; instead, they follow price trends previously seen- be it a long or short term trend. TA also indicates that when a crypto echoes one trend, it will also follow the exact opposite trend at some point in the future. The purpose of crypto traders is to use TA to make out these trends and make profitable strategies based off of them.
TA is also the analysis of the market demands and supplies over time, which represent the comprehensive crypto market sentiment. How? Well, the price of a particular crypto at a certain point in time is essentially an embodiment of the sellings and buyings going on at that time; which in turn shows the collective outcome of the sentiments of crypto traders and investors.
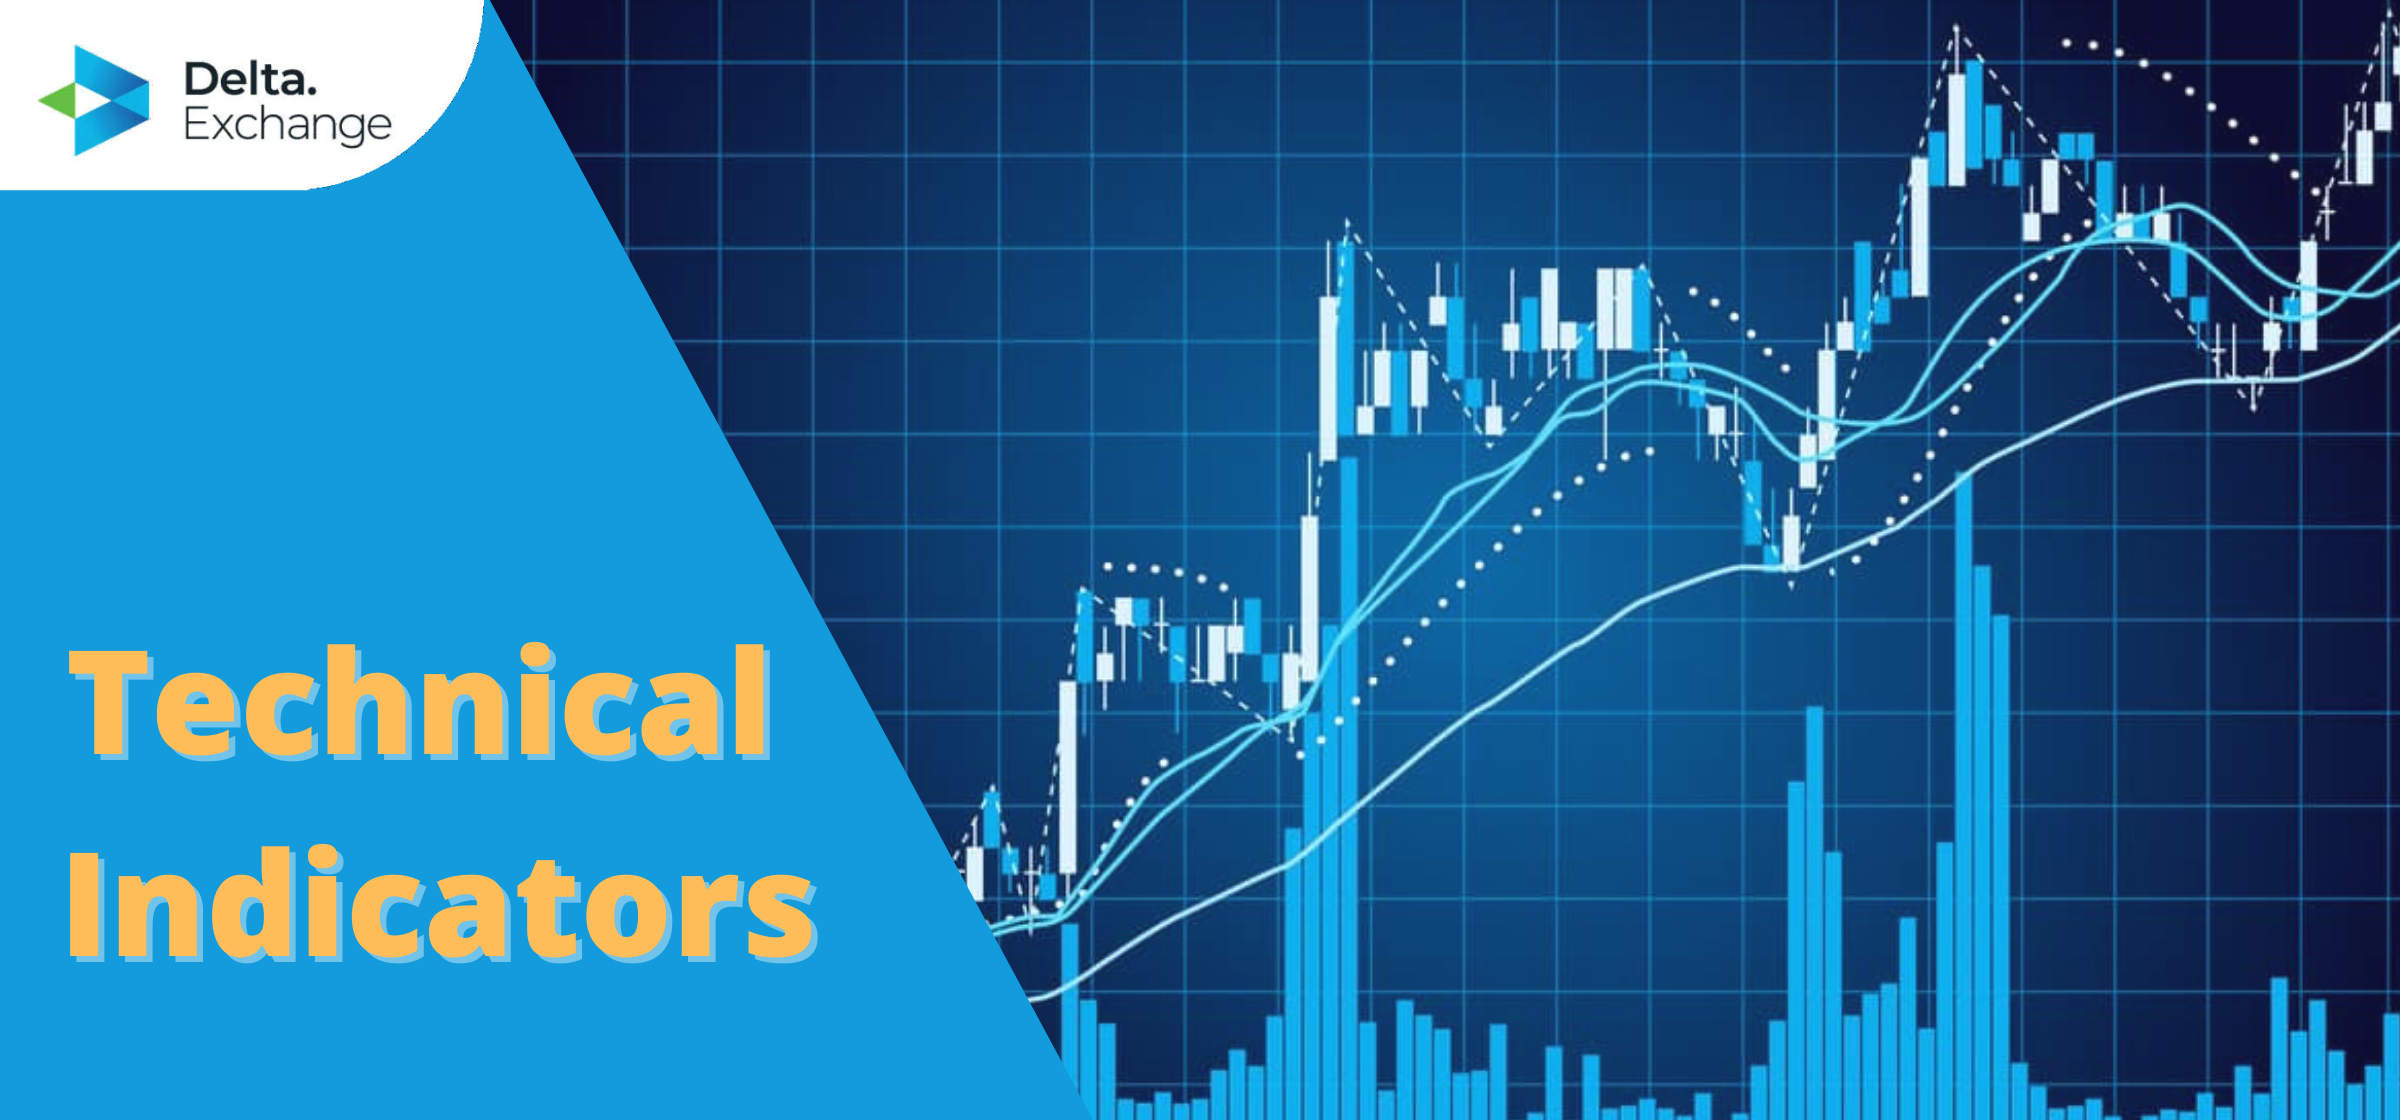
To conduct technical analysis and identify profitable opportunities in the future, crypto traders use a range of charting tools, also known as technical indicators. This is the reason why TA is also often called charting. Technical analysis indicators help discern previous market trends and, based on them, come up with predictions surrounding trends that may be seen in the future and their timings. Now, let’s take a look at some trusted technical indicators frequently used by crypto traders, shall we?
Some Oft-Used Technical Indicators:
1. Momentum Indicator:
This one measures the momentum in the price changes of a crypto. The momentum indicator is necessarily a line on a chart that shows how fast a particular cryptocurrency’s price is shifting. The higher the chart reading goes above 100, the faster the subject cryptocurrency’s price is rising. On the flip side, the quicker the reading goes down below 100, the quicker the crypto’s price is also going down. Traders who aim to enter cryptocurrency trades when the market volatility is high and leave when the momentum begins to fade are mainly the ones who use the momentum indicator.
2. Bollinger Bands:
John Bollinger is the creator of this particular trading indicator. The Bollinger Bands estimate market volatility. The indicator is essentially three bands, or lines, on a chart, where the middle band represents the price of a crypto asset. The closer the middle band is to the upper band, the nearer the crypto is to being considered overbought. Alternatively, the closer the middle band is to the lower band, the nearer the crypto is to being oversold.
The Bollinger Bands are also used by crypto traders to employ a specific trading strategy known as the Bollinger Bands Squeeze. How it works is that when the bands are really close to each other, the crypto’s worth gets ‘squeezed’ into a narrow space, so the pressure builds up within that small scope. The market pops out of the squeeze sooner or later, which heralds a period of high volatility. There’s one risk with this strategy, however; the crypto market, being as unpredictable as it is, can go either upwards or downwards. So the Bollinger Bands Squeeze strategy is a neutral one at the best of times.
3. The Moving Average:
Moving average, or MA, is a technical indicator that erases out random, short-term price shifts within a certain period of time. It’s used to identify price trends. A moving average can be determined through multiple methods. Two of the most used ones are:
- the simple moving average or the SMA, and
- the exponential moving average or the EMA.
They both point out market trends by analyzing past data, but there’s a prominent difference. SMA is determined by adding up the closing prices of certain cryptocurrencies within certain periods of time, then dividing the sum by said number of time periods; so SMA can provide information on the market trends for any stretch of time you please. But the EMA takes only the latest price data into consideration, therefore it’s not as flexible as the SMA.
4. RSI/ the Relative Strength Index:
RSI is a kind of momentum indicator that charts crypto prices, as well as the momentum with which the prices rise or fall along. It’s one of simplest and most useful technical indicators used by a range of traders- from beginners to experienced ones.
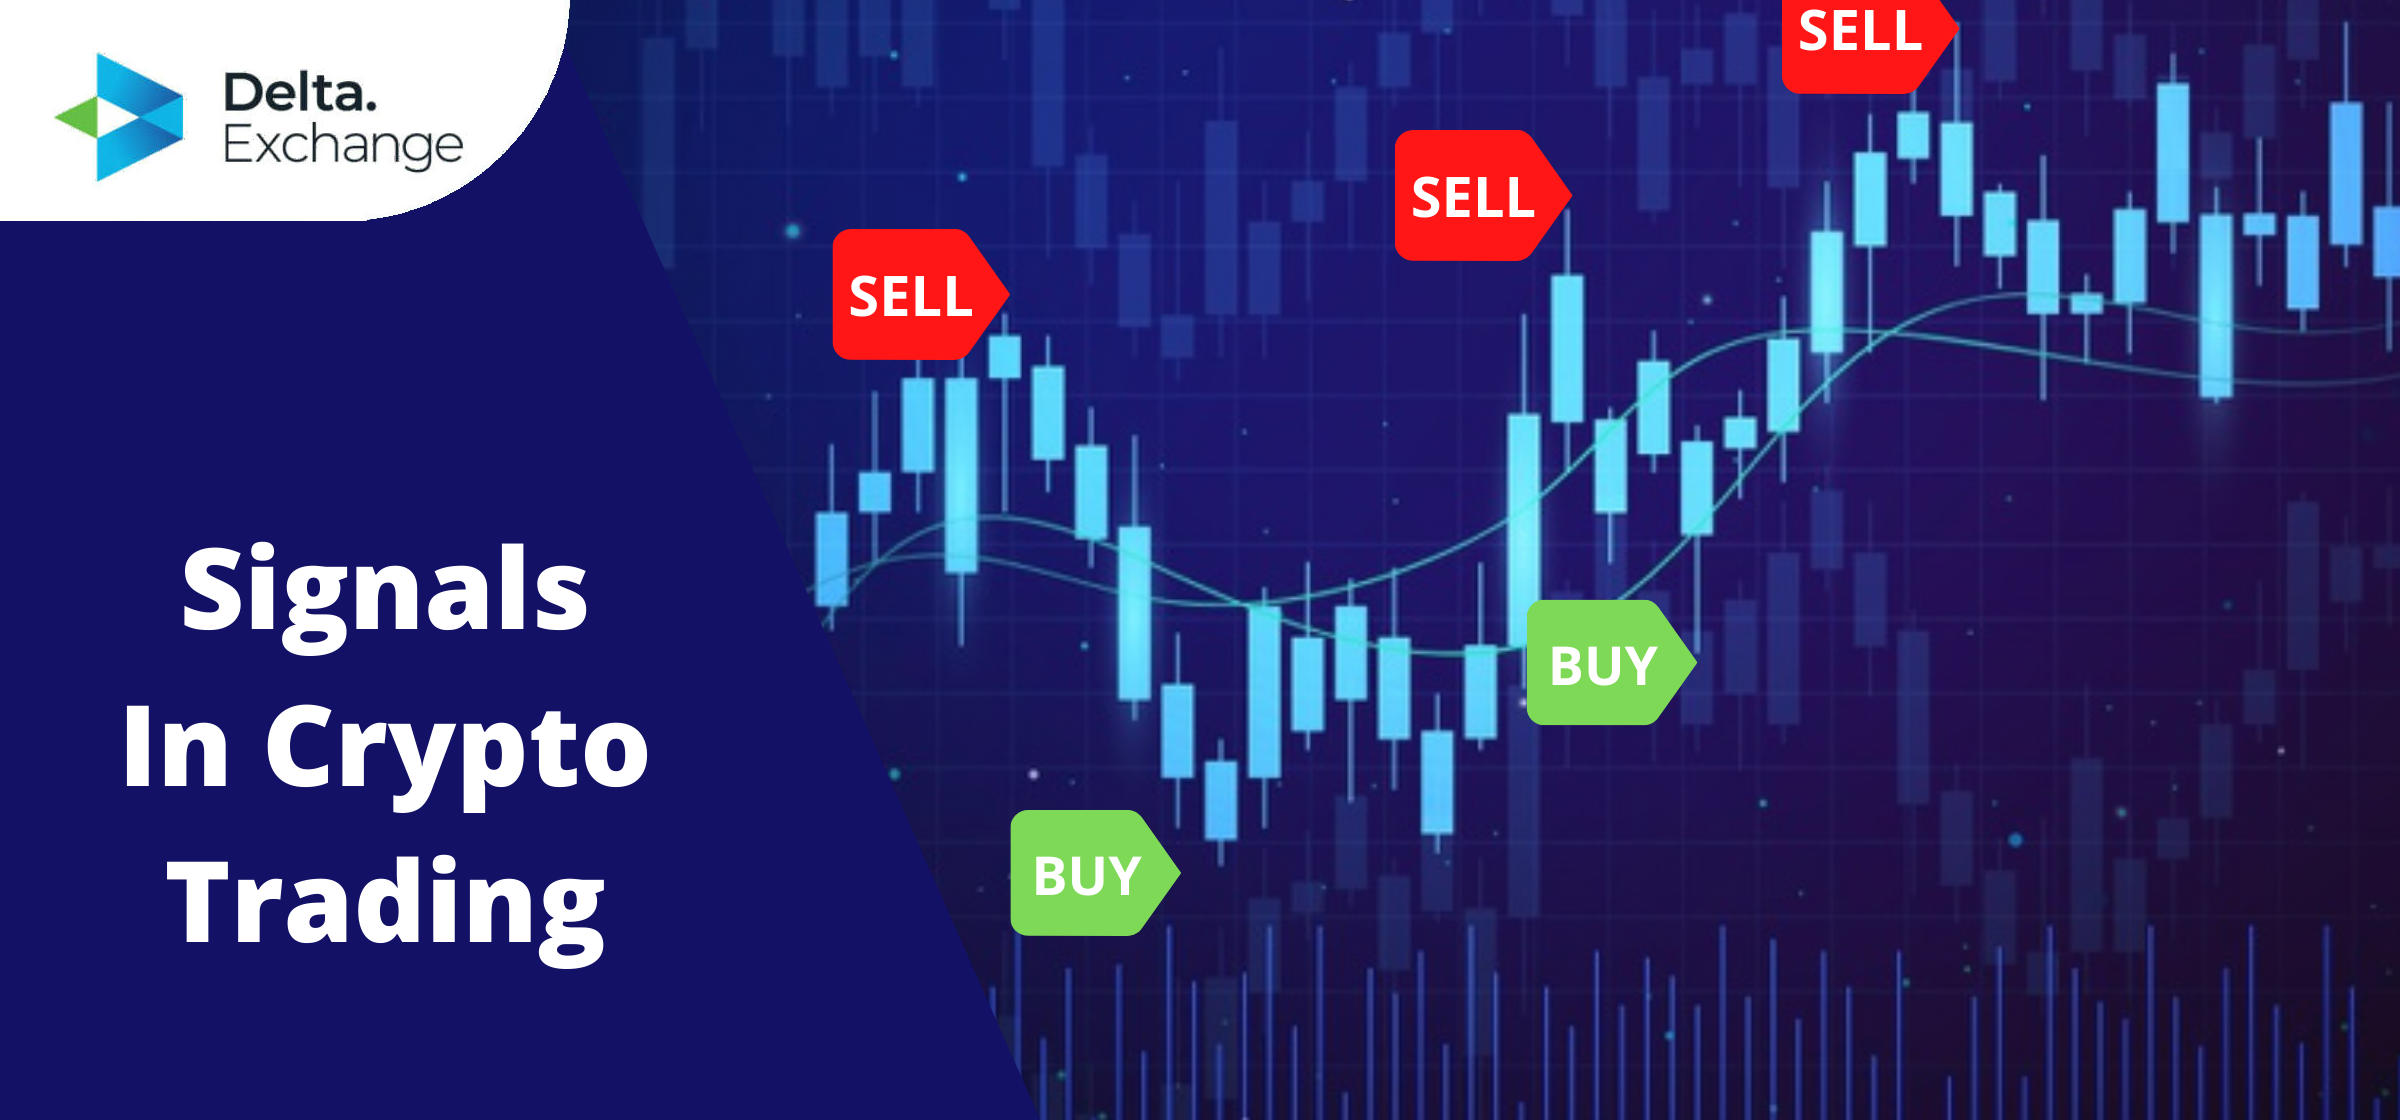
The indicator moves between the ranges of 0 and 100, with the data being displayed on a line chart. When the RSI value is 30 or lower, it indicates the cryptocurrency has been oversold, therefore signifying a buying opportunity. On the other hand, if the RSI value is at 70 or better, it means the cryptocurrency is overbought, so there’s a selling opportunity.
5. The Fibonacci Retracement:
This indicator uses the Fibonacci numbers in its mechanism. Fibonacci numbers, in case you weren’t aware, are any series of numbers where each digit is the sum of the two that come right before (for example: …, 2, 3, 5, 8, 13, 21, … …). There are Fibonacci retracement levels on the indicator, represented by horizontal levels each of which symbolizes a Fibonacci figure as a percentage.
The percentages, when put on a chart, can show plausible support and resistance zones. A cryptocurrency trader picks two points of their choice on a chart, then marks them as levels 0 and 100 respectively. Now the levels in between pointed out by the indicator would show probable entry and exit points, as well as display the stop loss order. The Fibonacci percentages used on the retracement levels are 0%, 23.6%, 38.2%, 61.8%, 78.6% and 100%. The 50% mark is a level many cryptocurrency traders add in, despite 50 not being a traditional Fibonacci number. Sometimes even Fibonacci percentages below 0 or above 100 are used, like 261.8% or 423.6%. If interested, you can check out our guide to Fibonacci Retracement in crypto trading that discusses this particular indicator in depth.
If you’d like to find out more in detail about technical indicators in crypto trading, you’re welcome to take a look at our blog post on the topic here.
Are There Any Risks Associated With Using Technical Analysis in Cryptocurrency Trading?
Quite a few cryptocurrency experts have deemed technical analysis a method that’s prone to errors and is ultimately unreliable. In fact, TA predictions are often labelled as ‘self-fulfilling prophecies’, as in they cause themselves to come true. While this is a very controversial take, it’s undeniable that a number of traders think that if a TA projection turns out to be true, it’s only because a great number of people believed it would happen.
There is some truth to the criticisms, though. Despite being based on data, a result produced by a TA tool would still be at least fractionally affected by the trader’s personal influence- which means if a trader is already fairly determined to reach a specific decision, they could possibly manipulate the TA instruments they are using to show the result they’d been expecting, all the while being oblivious to their own influence.
There’s also the theory that if a fairly heavy number of people operating in the markets use the same kind of indicators, the chances of their common prediction coming true increases. However, the counterargument has a lot of weight to it too. TA enthusiasts point out how even if many traders use the same sort of indicator, each of them has a distinct method of charting. Which means it’d be nearly impossible for any two traders to come up with the same trading strategy.
Apart from the whole TA vs. FA debate, many experts think utilizing a combination of both of the methods is the best way to go about a cryptocurrency trade. At the end of the day, neither technical analysis nor fundamental analysis is something you absolutely need to perform a profitable cryptocurrency exchange. However, they do provide assuring guidelines when it comes to analyzing crypto markets and identifying potentially advantageous trading opportunities, and especially so when trading cryptocurrency derivatives like crypto futures or options. Most exchange platforms, including Delta, allow you to employ many technical indicators to conduct a TA before investing or trading in cryptocurrencies.
FuturesTrade Futures & Perpetual Swaps on 25+ crypto assets, with up to 100x leverage
OptionsTrade call, put or MOVE options on BTC, ETH, BNB and LINK
Interest Rate SwapsInterest rate derivatives that enable swap of fixed-floating rates
Mock Trading PlatformLearn Crypto Derivatives trading without risking real capital
Research & AnalyticsExclusive data, charts and analytics to help you trade smarter


