For any queries, email us at [email protected]


For any queries, email us at [email protected]


For any queries, email us at
[email protected]

Crypto markets are relatively volatile and are prone to wild price swings. And since a crypto market operates 24/7, indicators like VWAP or Volume Weighted Average Price prove beneficial to determine the accurate entry and exit points in shorter time frames. Therefore, VWAP is preferably used by day traders for intraday trading for timing their entry and exits.
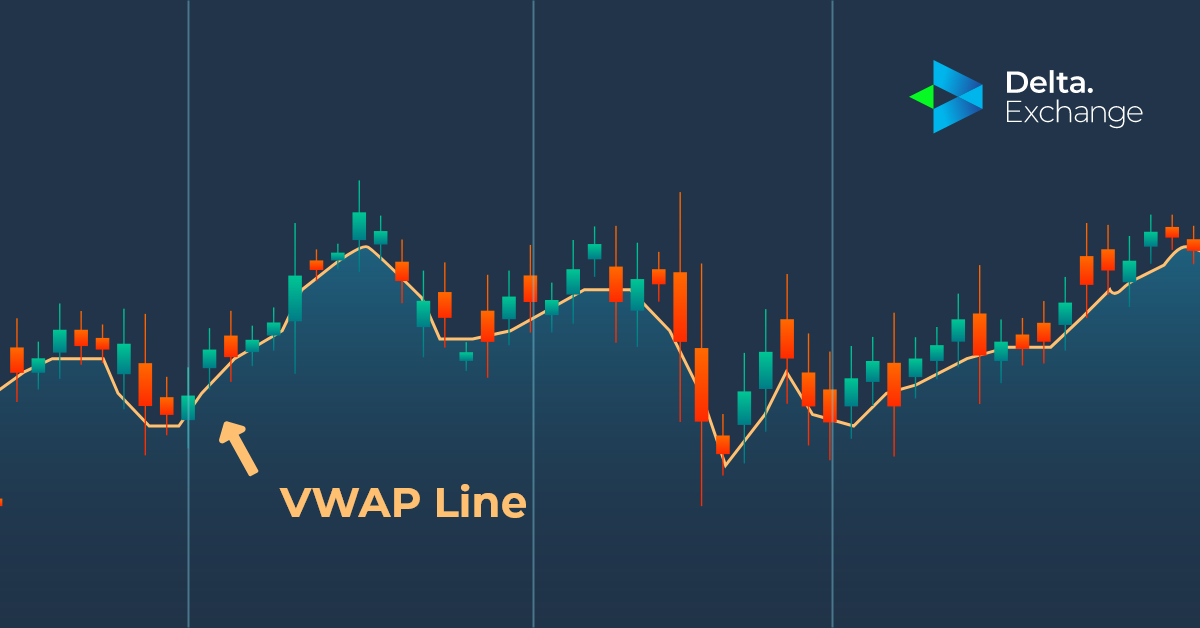
Crypto traders build their trading strategies using the VWAP line to ensure when to buy or sell. VWAP refers to the tool used by traders to compare the price against the volume traded to determine if the market is in overbought or oversold conditions.
What's in this post
When the VWAP indicator is interpreted correctly, traders are able to find good entries into the market. VWAP displays the relative value to trades previously placed. As such, traders can exit their positions when they see that the price action of particular crypto has gone far very quickly or vice versa.
To learn how a VWAP indicator works, we need first to understand how the value of VWAP is calculated. First, we need to know that the VWAP line is reset at the beginning of each day. This helps keep the daily VWAP values distinct and useful for day traders. The chart below clearly depicts a sharp slope in the VWAP blue line as trading starts the next day. This is due to the VWAP calculation being reset.
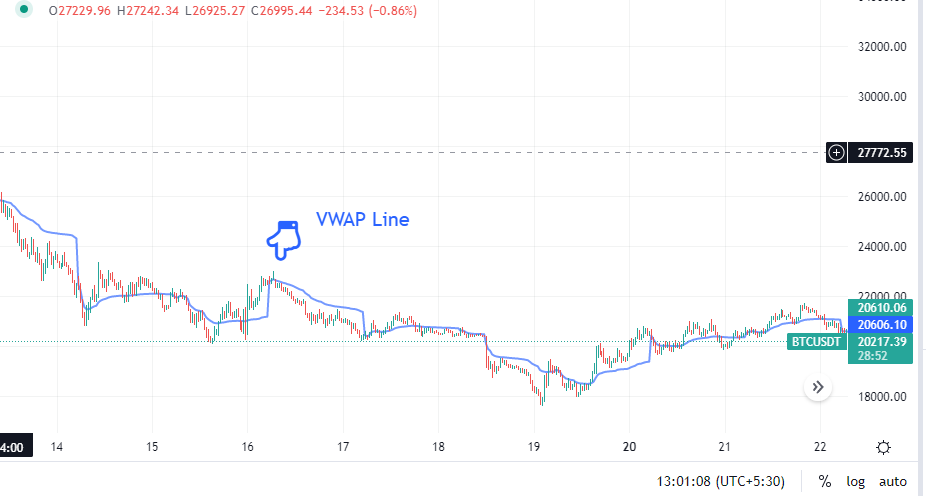
Source: TradingView
VWAP line connects the typical prices of a candle time frame. A typical price is the average high, low and close prices for a particular candle.
Typical Price= (High+Low+Close)/3
While most chart patterns consider the closing price of a candle time frame, VWAP considers the three price levels and arrives at the true price by taking their average by default. For instance, in the chart above, VWAP concerns the true price of each 30-min candle time frame. VWAP, as such, allows the trader to understand current and future market trends.
Using Typical Price to form the VWAP line: Once we calculate the typical price, we need to multiply it by the volume traded during that time frame to arrive at the current time frame subtotal.
Current Time Frame Subtotal= Typical Price * Volume
= TP*V
Once you calculate the subtotal for the particular timeframe, say 30 minutes, the subtotal gets added to the subtotal for the trading day, thereby creating a cumulative TP*P value.
The last part of the calculation involves arriving at the ratio of the cumulative TP*V and the cumulative volume, which gives us our VWAP value at a given time frame.
VWAP = Cumulative [TP*V] / Cumulative Volume
These individual VWAP figures are joined together to form a line that is in line with the crypto price generally and moves through the price chart as the VWAP indicator. These calculations are automatically done by computer charting software.
Since VWAP is a tool great for determining day trading strategies, traders who are likely to day trade, i.e., hold their crypto for less than a day, can prefer using VWAP. Traders should use minute charts like 1-minute, 3-, 5-, 15-minute, etc., of shorter time frames whale using VWAP. This allows traders to analyze how the average price responds to the amount of volume being traded.
VWAP is not suited for Forex trades as they are over-the-counter trades. However, it is s great indicator for stock and crypto trading as these trades are facilitated via exchanges which record the volumes required for calculating the VWAP.
VWAP is used to determine the average pricing in relation to the amount of trading volume for that particular price level. We have already discussed in detail how to calculate the VWAP values, which represent the true average price at a particular time and volume.
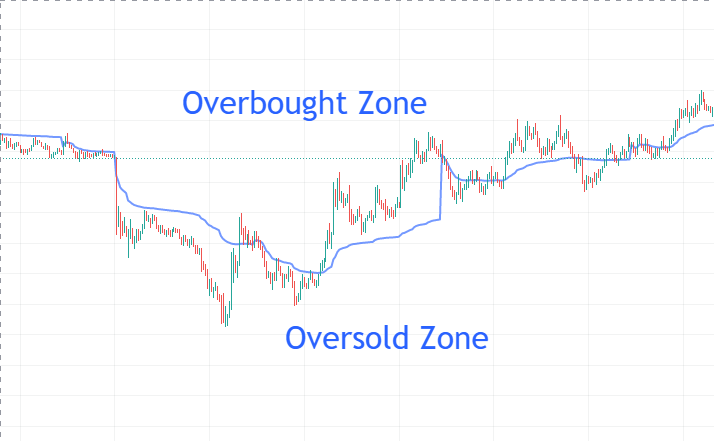
Considering the VWAP line as the true average precise line, any price above the VWAP line is considered expensive and in the overbought range, as depicted in the chart above. If you buy in the overbought zone, you are paying more for the trade.
Similarly, any price below the VWAP line denotes an oversold level or an underprice range. An oversold or underpriced zone is a good buying opportunity for any trader. A trader cannot prevent the prices from dipping further below, but they are surely buying the cryptocurrency at a much lesser price than when it is in the overbought range.
While crypto markets function 24/7, trading volumes or activity are mostly low during the weekends. As VWAP is a day trading tool, it is calculated every day and even on weekends. But VWAP tool may not be suitable during the weekend, as any large trade can cause significant changes to the market conditions. Hence, VWAP should be considered an employable technical tool from Monday to Friday. Let’s learn a few strategies using the VWAP tool:
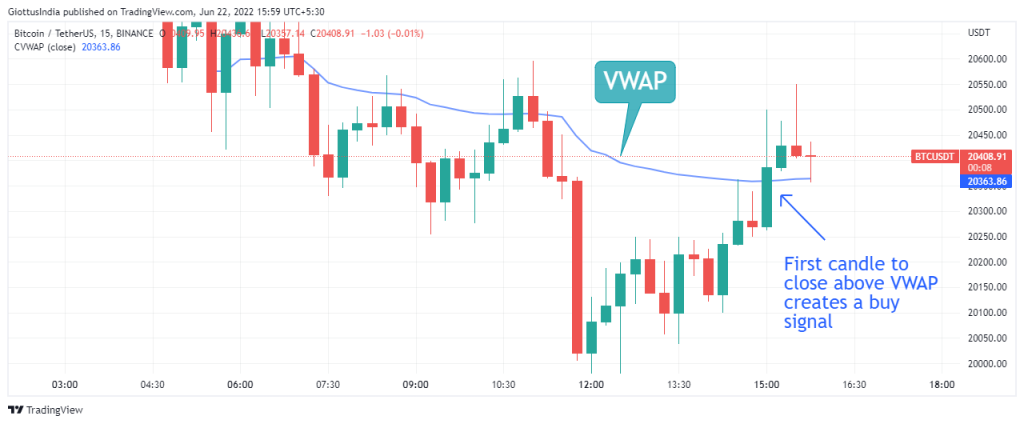
The Retracement Trade: Below is a 15-minute BTC chart with a VWAP indicator denoted by a blue line. Confirm that the market is in an uptrend and look for long positions based on it. To open a long position, first, wait for the price to dip and close below the VWAP. This close will call for an open alert of an approaching buying signal.
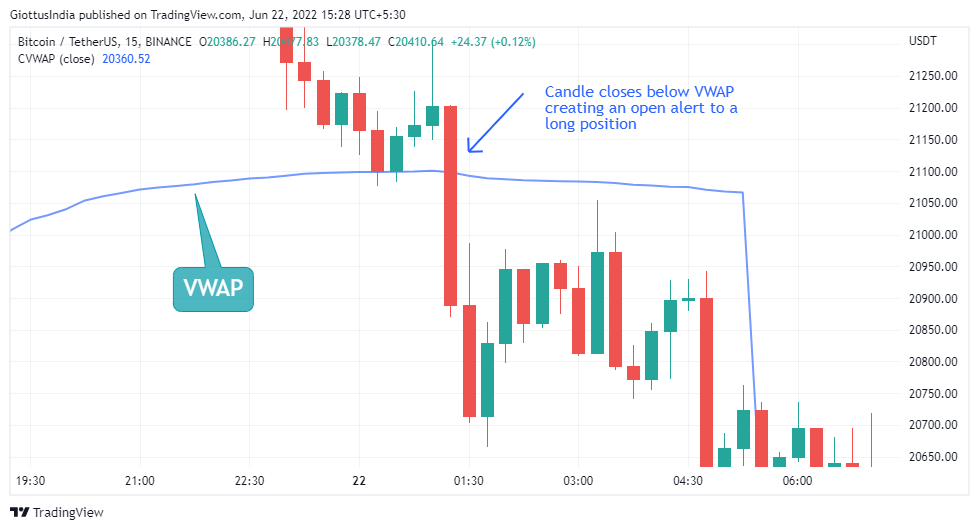
Once the candle closes above the VWAP, traders can enter a long position. The stop loss can be set just below the recent swing low. This way, even if there’s a price correction, it will happen back through the VWAP.
The VWAP calculator is reset every day to benefit the day traders. But there are times when the traders are interested in seeing the overall weighted pricing trend. Moving VWAP, or MVWAP, is what comes to the rescue in situations like these.
A moving VWAP can be said to be a moving average of VWAP. A moving average captures the average change in data series over time. There are a few notable differences between the two:
No doubt, day trading is a risky venture in crypto trading. VWAP is an important measure for traders to add more consistency to their trades. VWAP may create false signals when the market witnesses a lot of activity.
Volume is a major consideration while calculating the VWAP indicator. During days when the markets suffer from weak volumes, the trading environment is likely to be rangebound. In such circumstances, VWAP may not be a reliable indicator.
While VWAP is a good indicator for determining when the prices are relatively cheap or expensive, using VWAP as a standalone indicator can bring in inaccuracies in the technical analysis and, ultimately, in trading decisions. Some relevant indicators that go well in conjunction with VWAP are pivot points, support and resistance trendlines, etc.
VWAP is a great tool for offsetting indecisiveness and random trades. It provides the average weighted price, which the day traders can use to their advantage and day trade their way to multiple profits. Using other technical analysis tools like channel bands, pivot pints, and trendlines with VWAP, many new trading strategies can be developed. Traders should be careful, use the VWAP indicator judiciously, and avoid false signals.
Q1: Which is the best candle time frame for VWAP?
Ans: Any short-term time frame of 1-, 2-, 3-, or 15-minute is suitable for VWAP.
Q2: VWAP is suitable for what kind of trading?
Ans: VWAP is suitable for day trading, in conjunction with other indicators, as the VWAP indicator resets itself at the start of a new day.
Q3: What does a VWAP indicator determine?
Ans: A VWAP indicator determines the average weighted price at a particular trading volume.
Q4: How should a trader trade the VWAP indicator?
Ans: Any price movement or closing of a candle below the VWAP indicates an approaching buy signal. As soon as any candle closes above the VWAP line, the traders should enter a long position and place a buy order.
Q5: Where should the stop loss be set?
A stop loss level should be set below the recent price swing when using the VWAP indicator for trading.

What if you sold an ETH straddle daily for six months (June 2023 to Jan 2024)? How would your capital have grown? What levels of risk would you have been exposed to? Description of Trading Strategy Underlying Asset: ETHEREUM (ETH) Strategy Type: Daily ATM Straddle Selling (A straddle simultaneously
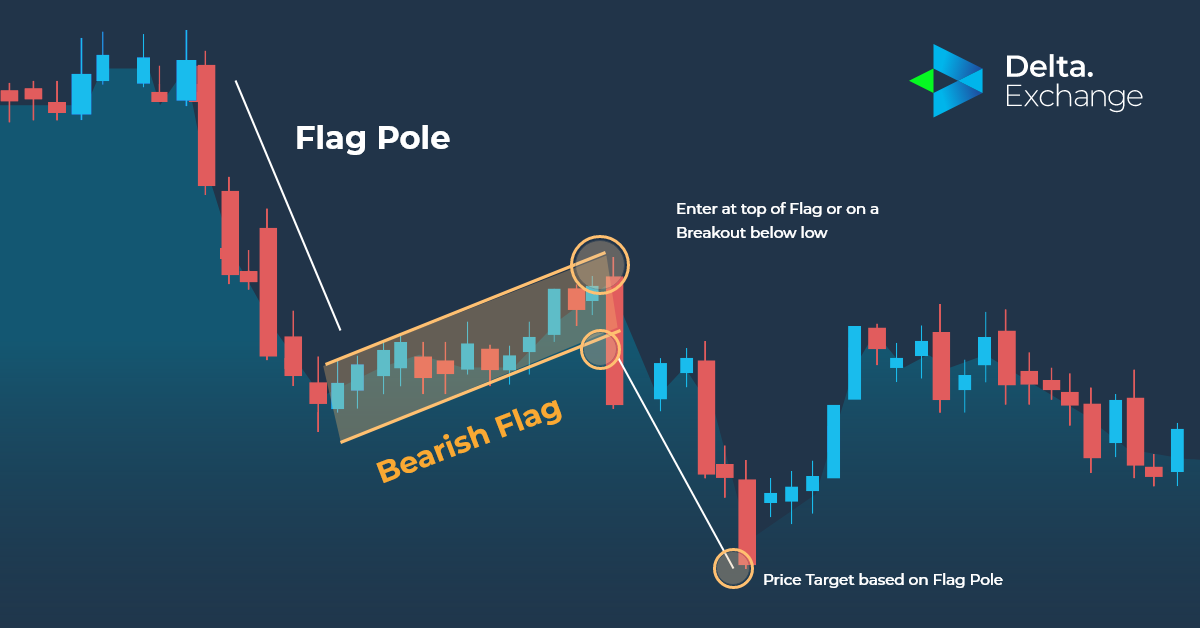
Pattern trading requires spotting trends and formulating trading strategies based on the pattern. There are specific chart patterns that represent a particular trend in the crypto market. Spotting trends or patterns may be challenging for beginner, especially in a volatile market like cryptocurrenci
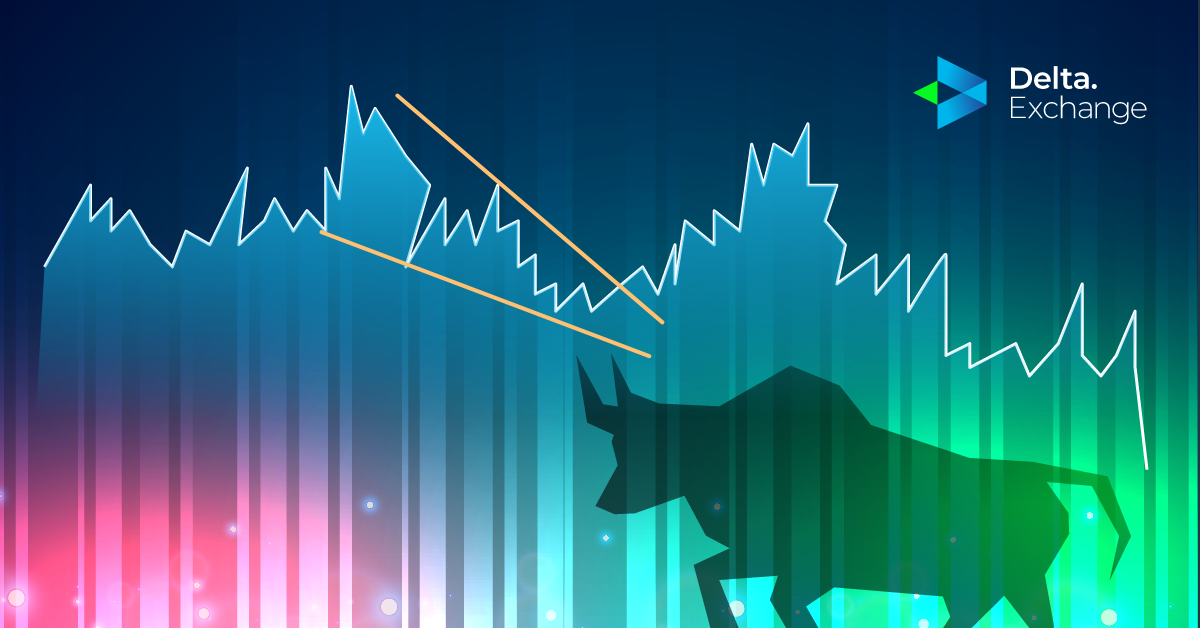
A crypto trader is more likely to succeed if they buy an asset from a logical position than randomly buying an asset without proper thought and analysis. Technical analysis can be a great way to analyze and assess the markets before making your next buying decision. A falling wedge pattern is an imp

A chart pattern occurs in response to the price movements of a crypto asset that may mirror a common shape like a rectangle, triangle, head and shoulders, etc. These chart patterns present the traders with a visual way to trade. Chart patterns provide traders with several advantages, including logic
Stay Connected With News, Updates And More
