For any queries, email us at [email protected]


For any queries, email us at [email protected]


For any queries, email us at
[email protected]

History will always remain an important factor to consider before taking a risk, be it in the financial market or the real world. When the history of a venture is properly analyzed first, there is a strong tendency that the analysis would influence a great decision.
Candlestick charting is one of the modern methods of analyzing the history of an industry, especially in the financial sphere. You must have seen candlesticks in your journey through financial markets like forex, crypto, and stocks. Though the method appears novel, it has existed in 18th century Japan and began gaining global popularity in the 1990s.
It is now a common feature in virtually every industry that deals with monetary values or measurable units. However, despite the usefulness of this method, most traders still find it much too complex and nearly unfathomable. Nevertheless, candlesticks are not too difficult to understand if you can get a basic grasp of their concept.
In this article, we are going to offer the insights you need to be able to understand the candlestick charting method. This would go a long way to develop your knowledge about the crypto market and enable you to make better decisions.
What's in this post
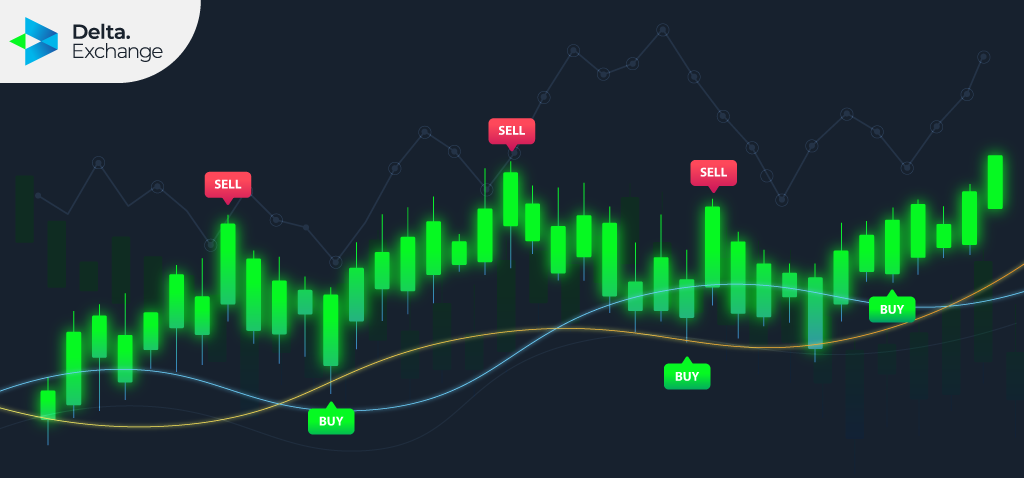
Simply put, a candlestick chart is an instant picture of movements in a market in either a negative or a positive degree. The movement can be the price action of a crypto asset, or the activity revolving around it. A candlestick chart is often placed in different time frames. Normally, most exchanges exhibit them in a 15-minute range but a trader can decide to expand them in either an hour range, four hours, a day, a week, or more.
The obvious colors in candlesticks are green and red, both colors perform differently. Green candles indicate the uptrend of a market as buy orders while red candles indicate the downtrend of a market as sell orders. However, there is much more to candlesticks than just exhibiting price actions. Especially in the crypto market, professional traders read candlesticks to dictate the sentiment of a market and make their decisions based on the insights received.
The anatomy of candlesticks might be quite complex to a novice. However, a careful approach would make them easier to interpret, and indispensable in the long run. The crypto market is always open ‘round the clock’ unlike the stock market and therefore, it is essential to know the occurrences in the market while you are away.
Candlesticks are a reflection of the price simulations in digital currencies. The most visible part of a candle is the “body” which is a rectangular line that embodies the price action of a digital asset. The body of a candlestick can either be red or green, depending on the situation of the market. Candlesticks function through the use of four main components; open, close, high, and low.
To interpret candlesticks accurately, you have to know what each component signifies. The “open” is native to green candles, at the bottom. It indicates when the start of a trade of an asset. The “close” is peculiar to the red candles and indicates when price action has concluded. On the other hand, the “high” and the “low” are lines above the body of a candle and they indicate the highest and lowest values attained during particular price action.
Just as earlier mentioned, traders make better decisions if they can interpret candlesticks accurately. Just so you know, a streak of green candles is described as “bullish” while a streak of red candles is regarded as “bearish”.
Some formations occur in a candlestick chart when there is price action. For example, if a particular cryptocurrency rises from $20 to $27, there would be a change in the pattern of a candlestick. This is often what expert traders rely on to maximize the volatility; helping them know when to get into a trade, or get off if there is a reversal.
Market sentiments preside over the cryptocurrency market and we are going to explore three main candlesticks that gauge the emotion of the market towards an asset.
Doji comprises extremely slim candles of equal-length wicks which indicates indecisiveness towards a crypto asset. When a cryptocurrency sways between the two directions before closing the price action near or with the opening value, a Doji candle is made.
With Doji, traders can rate the indecision in the market and make up their minds on the next action to take. A Doji often precedes a short or long-term bull or bear, depending on the ruling sentiment.
Physically, hammers possess only one wick located at the top of a candle and often twice its size, making it look like a “real hammer”. The hammer in a trading chart occurs when the value of an asset goes below the open range and then returns to close above the open range. Significantly, this is a result of back-and-forth control switching between sellers and buyers.
The shooting star is often classified as the opposite of the hammer candlestick. Physically, it appears to look like a hammer turned down. A shooting star candle forms when buyers rally to open a trade, thereby moving uptrend for a short period before losing to sellers again and causing the price action to close below the open range.
Aside from the three candlestick formations described above, there are numerous others like the piercing line, three white soldiers, the morning star, and the three black crows. However, the above highlights are the most paramount and form the foundation of others.
Trading in the financial market requires knowledge of previous actions and predictions for future expectations. Candlestick charts possess the information that traders need to make proper predictions and understand the movement in the market.
Since the crypto market is volatile, the candlestick exposes the depth of volatility of a digital asset in the past and reflects what to expect in the future. There are so many trading tools, however, the candlestick remains an indispensable one.

What if you sold an ETH straddle daily for six months (June 2023 to Jan 2024)? How would your capital have grown? What levels of risk would you have been exposed to? Description of Trading Strategy Underlying Asset: ETHEREUM (ETH) Strategy Type: Daily ATM Straddle Selling (A straddle simultaneously
Trading the financial market, especially the stock market, is a game of wits and proven strategies. The risks inherent in the market (stock, crypto, etc) could make one run at losses, especially for newbies. Besides, it is no news that some of the financial markets are manipulated. So how do traders
Technical analysis, brought into the traditional financial markets largely by journalist Charles Dow, is the method of using past market data to predict the future of a particular asset or the market as a whole. The basic theory of technical analysis is that when it comes to market trends, history r
Charles Dow, a prominent journalist and the founding figure of the Wall Street Journal, was one of the first people to point out that some market trends keep repeating themselves, and if monitored, they can give traders and investors an idea of what the future of a financial product or the overall m
Stay Connected With News, Updates And More
