For any queries, email us at [email protected]


For any queries, email us at [email protected]


For any queries, email us at
[email protected]

MACD, fully known as Moving Average Convergence Divergence, is a common and technical tool among traders used to identify price trends and movements in financial markets. The technical analysis indicator was first developed in 1981 by Gerald Appel, and is still in use, even 40 years later. Traders employ the use of the MACD due to its relevance in trading – it helps them identify opportunities in the market.
What's in this post
The MACD is a trend-following momentum indicator. As such, it is a handy tool for traders who want to capitalize on it to interpret the direction, strength, momentum and duration of a trend on the price of a crypto asset.
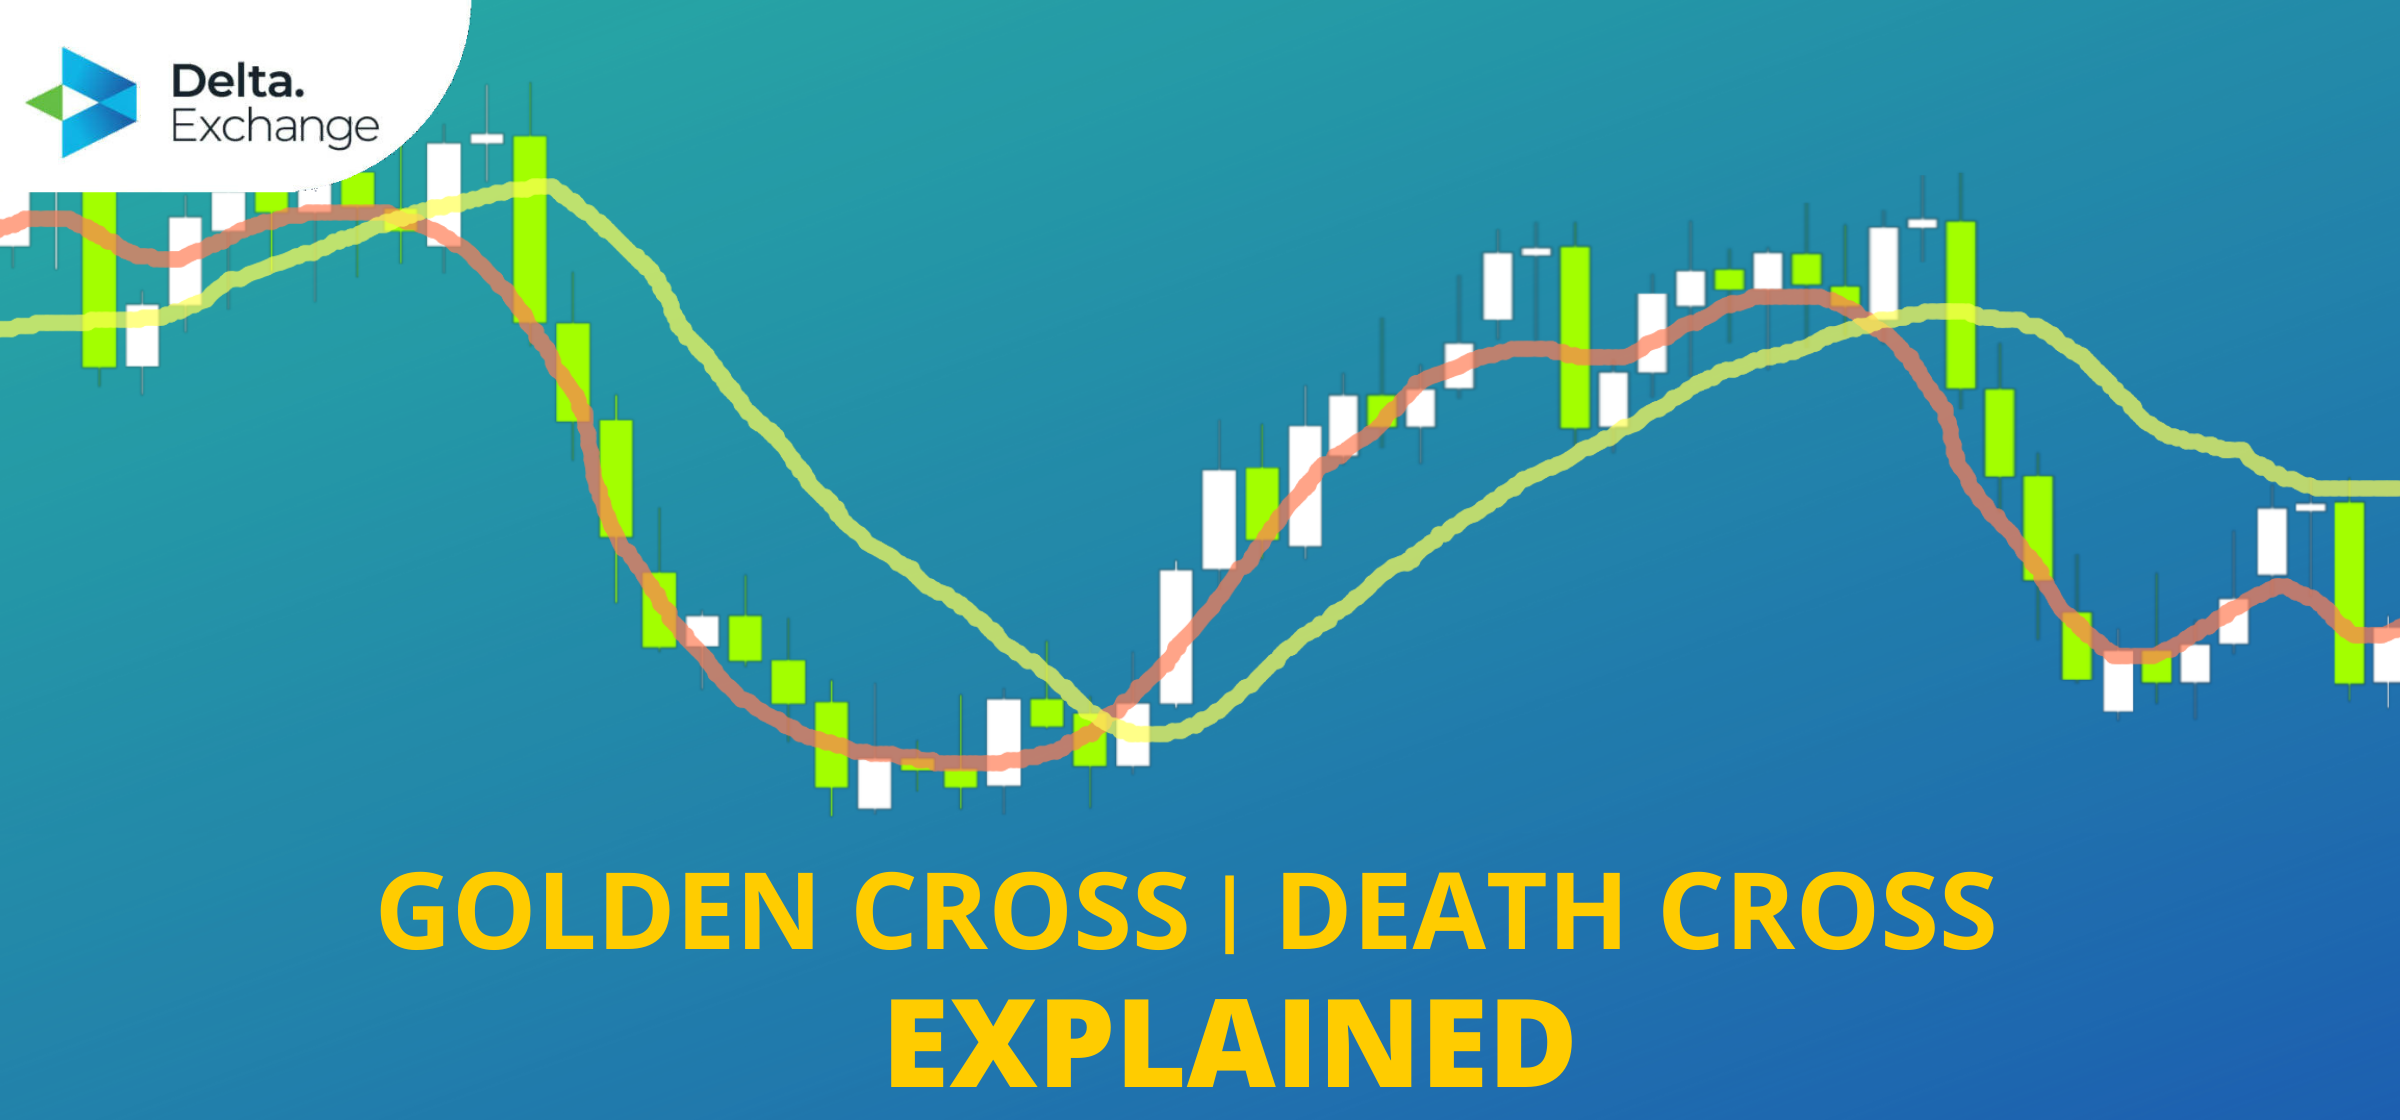
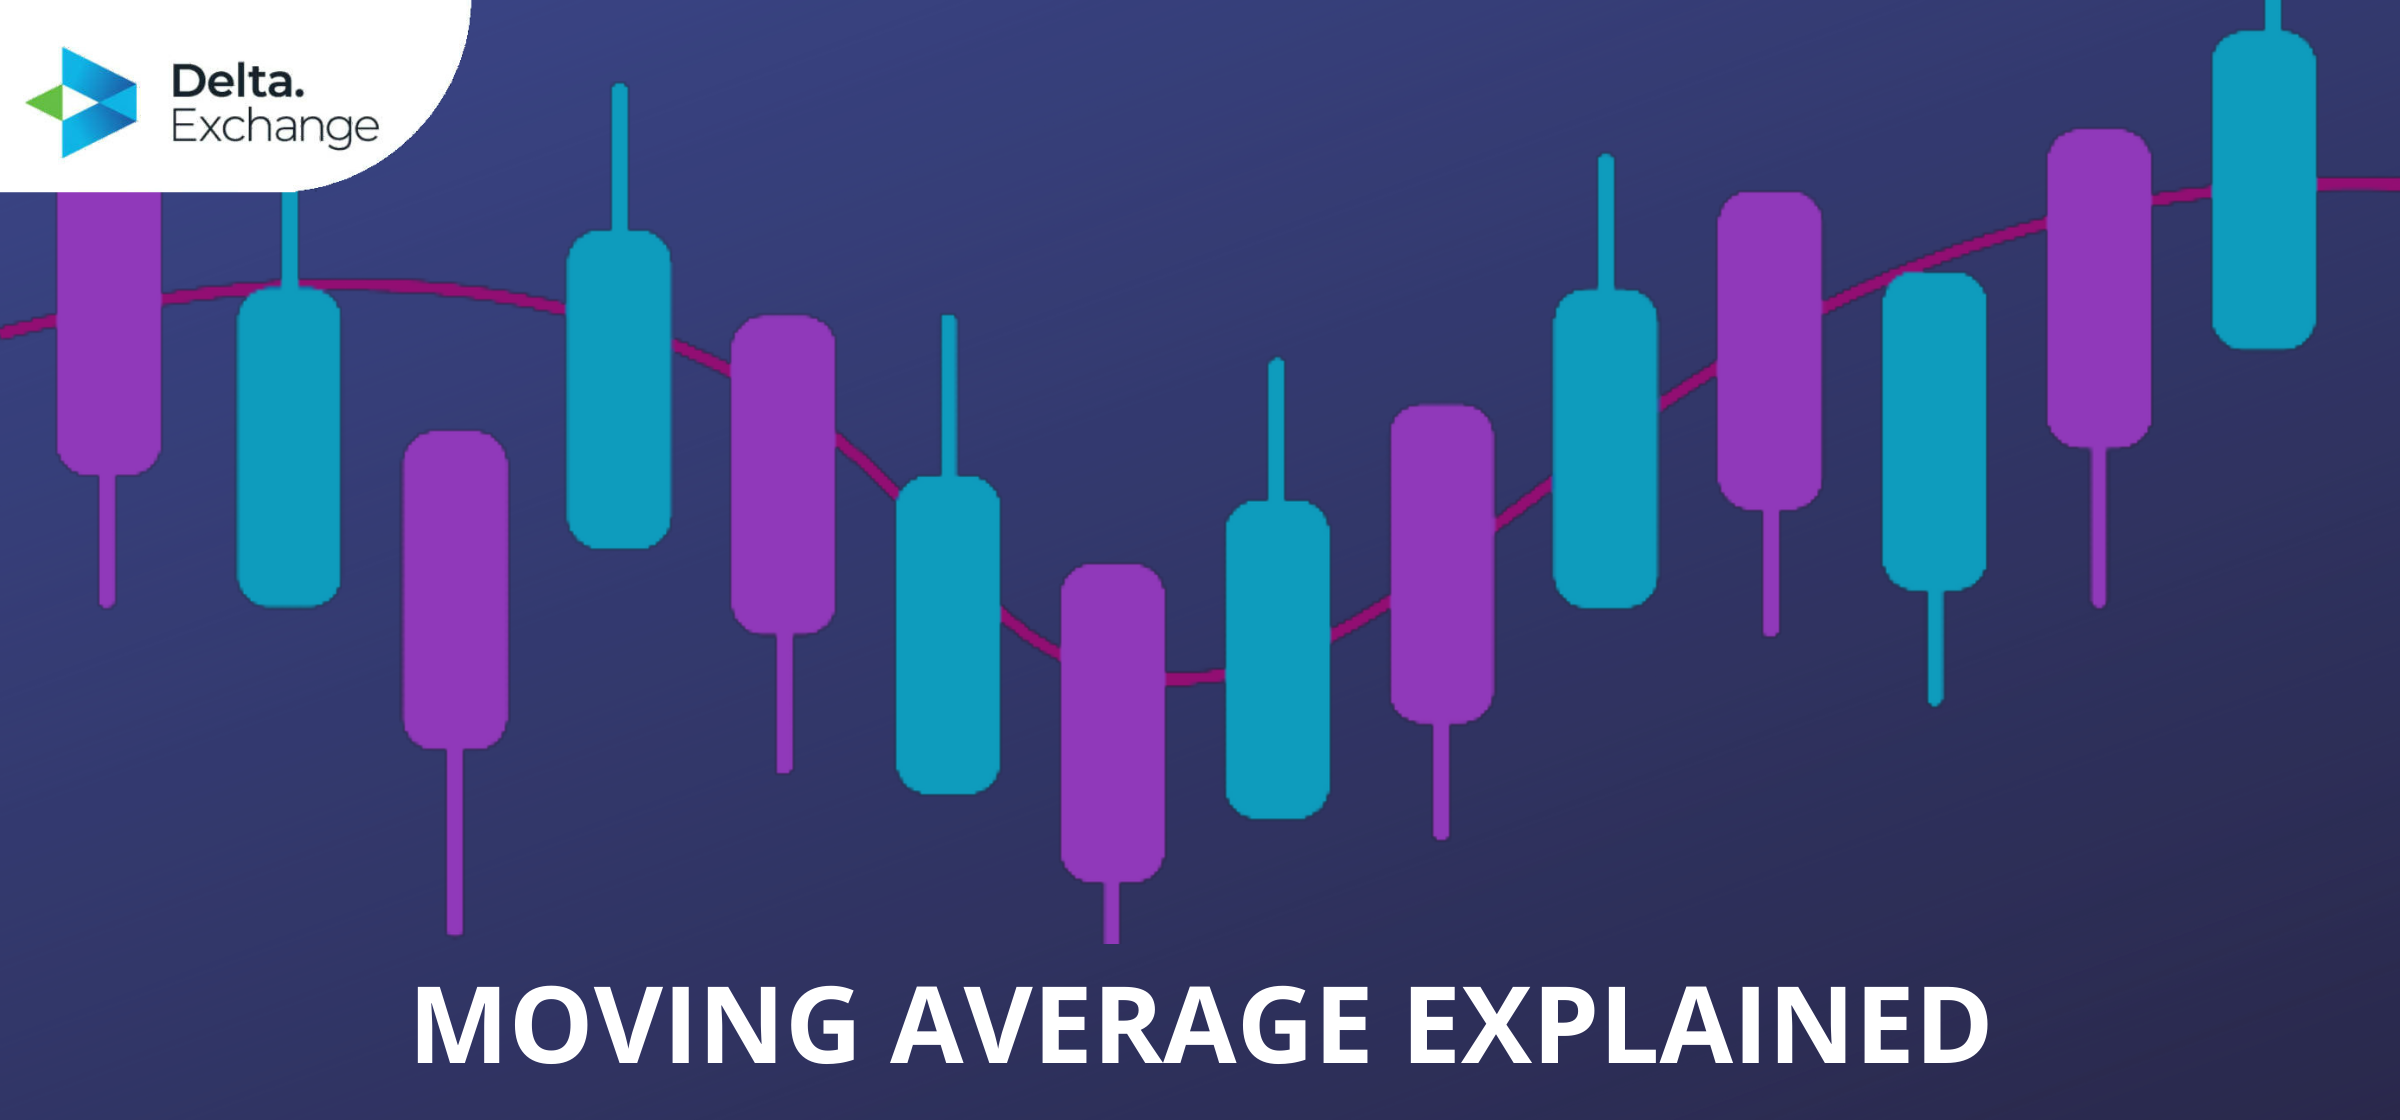
Using three components- two moving averages and a histogram, the MACD identifies trend direction and duration. There are two lines within the indicator which both have the appearance of simple moving averages (SMA) but are actually exponential moving averages (EMA).
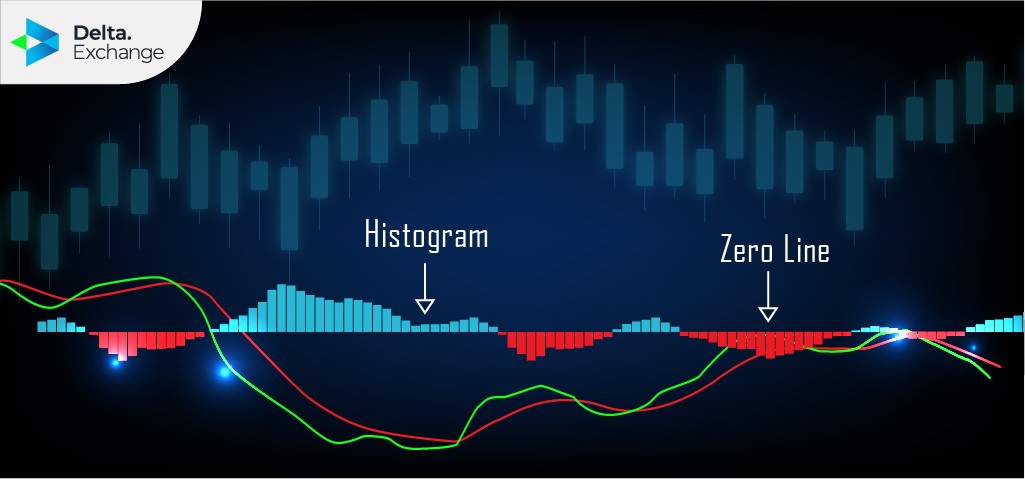
What the MACD does is it creates a histogram which indicates the difference between the two moving averages (MACD Line) and the exponential moving average of these two moving averages (represented by the Signal Line). It is the histogram that moves downward or upward- depending on the momentum- across what is known as the Zero line.
Where the two moving averages are separated from each other, they are ‘diverging.’ However, if they close in on the gap between them, they are making a ‘converging’ move. Hence the term ‘Convergence and Divergence.’
The histogram confirms the trend momentum of any crypto asset. For instance, a crypto asset like Bitcoin, the histogram’s move above the Zero Line indicates an uptrend while a move below the line points to a downtrend on Bitcoin.
Traders will likely long Bitcoin when an uptrend has been confirmed such that higher highs and higher lows are being reached and resistance levels have been breached. Lower highs and lower lows and breached support levels indicate otherwise.
A MACD chart is usually set according to three numbers. These numbers have different connotations.
There is a mathematical representation for MACD;
macd = ma(source, fast_length) – ma(source, slow_length)
signal = ma( macd , signal_length)
histogram = macd – signal
where exponential moving average ( ema ) is in common use as a moving average (ma)
fast_length = 12
slow_length = 26
signal_length = 9
The crypto market is studied by expert traders, and the MACD is one of the tools that aids them in understanding the nuances of the market. In view of this, the MACD has some advantages, some of which include;
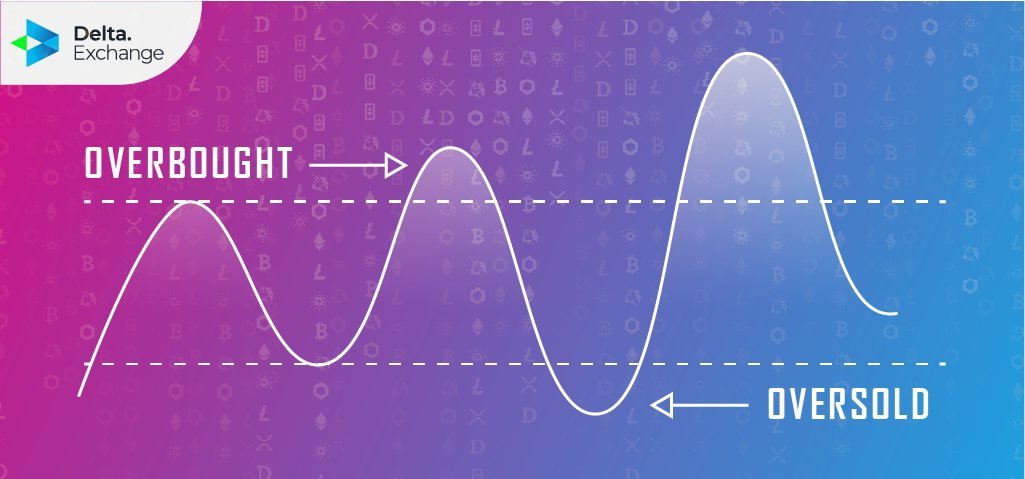
Despite being a useful tool, the MACD can be misleading on certain occasions. In such instances, it is advisable to consult the MACD for trend momentum and duration alongside other technical indicators like stochastic oscillator, Bollinger bands and the Relative Strength Index (RSI). Moving Average Convergence Divergence is used for identifying three kinds of primary signals- Signal Line Crossover, Divergence and Zero Line Crossover.

What if you sold an ETH straddle daily for six months (June 2023 to Jan 2024)? How would your capital have grown? What levels of risk would you have been exposed to? Description of Trading Strategy Underlying Asset: ETHEREUM (ETH) Strategy Type: Daily ATM Straddle Selling (A straddle simultaneously
Trading successfully requires the utilization of several analytical tools and programs. Historical patterns of a trading chart are measured by these tools and RSI is one of them. RSI is an acronym for the Relative Strength Index. It simply implies the measurement of an asset over several days inst
Technical analysis, brought into the traditional financial markets largely by journalist Charles Dow, is the method of using past market data to predict the future of a particular asset or the market as a whole. The basic theory of technical analysis is that when it comes to market trends, history r
Charles Dow, a prominent journalist and the founding figure of the Wall Street Journal, was one of the first people to point out that some market trends keep repeating themselves, and if monitored, they can give traders and investors an idea of what the future of a financial product or the overall m
Stay Connected With News, Updates And More
