For any queries, email us at [email protected]


For any queries, email us at [email protected]


For any queries, email us at
[email protected]

Trading successfully requires the utilization of several analytical tools and programs. Historical patterns of a trading chart are measured by these tools and RSI is one of them.
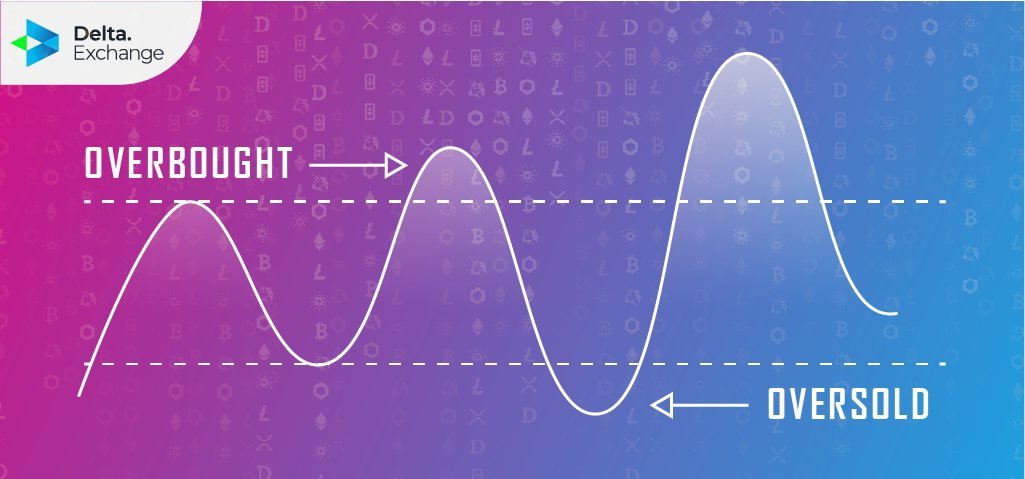
RSI is an acronym for the Relative Strength Index. It simply implies the measurement of an asset over several days instead of relying on single price points. The RSI is a technical indicator that calculates the momentum of a digital asset to determine if it is overbought or oversold. When the price actions shift between these possibilities, they are referred to as oscillations. The oscillations for RSI are hinged from zero to 100.
What's in this post
RSI was introduced into the financial market in 1978 by J. Welles Wilder Jr and has become a useful indicator to assess the performance of an asset. The default period of its measurement is 14 days but it can also be extended or shortened into minutes, hours, days, weeks, or months.
The formula for calculating Relative Strength Index is as follows:
Relative Strength (RS) = Average Close Up/ Average Close Down
Average Close Up = Total gain per period /time frame
Average Close Down = Total loss per period/ time frame
RSI = 100 − [100/(1 + RS)]
However, when you apply the RSI indicator on the exchange you use, you do not have to do these calculations. This is because the exchange computes them automatically for you.
The Relative Strength Index is a great way to tell the probable movements of a digital asset. Traders leverage it to make their conclusions on whether an asset would turn bullish or bearish. To maximize this indicator, a trader often buys when the asset in question is oversold and sells then sells when it is overbought.
If a cryptocurrency is overbought, there is a tendency that the market trend might take a bearish narrative. On the other hand, an oversold digital asset predicts a bullish break as it gathers momentum. Using RSI, when a cryptocurrency’s RSI is under 30%, it is considered oversold. Equally, when it sits from 70% and above, it is perceived to be overbought.
The above scenario depicts a pattern close to particular market trends. RSI can also be utilized to pick a new trend in the price action of a digital asset. A common way is to either buy or sell when the RSI of a cryptocurrency is placed in the middle. Traders often opt for this method to participate in a new market trend.
This method is referred to as midline cross-trading. Most investors would place their entry on the RSI ratio of 60/40, 70/30, or 50/50 to mark resistance and support levels.
Just as mentioned earlier, RSI ranges from zero to 100. When the RSI of a digital asset goes above 70, it signifies that it is overbought while ranges below 30 are oversold. You must understand how to read the indicator of the asset you’re observing.
Most times, if a cryptocurrency aligns in a tight range within a long period like 14 days, its RSI might be neutral. With this momentum, the RSI could switch to the extreme of either a bull or bear.
RSI ranges can also be used to check market sentiment. If an RSI range bounces above 50, we might expect that the trend is strong and confirm it for long opportunities, the opposite applies if the trend is below 50.
When the oscillator does not move in coherence with the current price action, we can say that there is an RSI divergence. Fundamentally, an RSI divergence indicates bullish or bearish positions. if a lower low price movement is seen on a chart that contrasts a higher low on RSI, it is a bullish divergence. On the flip side, a bearish divergence is seen when the price movement is on a higher low while the RSI sits on a higher high.
Swing rejection is a trading technique that leverages the RSI indicator. In uniformity with RSI divergence, swing rejections are divided between bullish and bearish scenarios. Categorically, bullish swing rejections are placed out in these four instances.
Similarly, the bearish swing rejections complement the bullish scenario. It is categorized into for instance as well.
The swing rejection technique better adheres if there were similar occurrences in the past that toed the same pattern.
Just as mentioned earlier, there are several tools and techniques used to rate the market. The Relative Strength Index is perceived to be one of the most efficient tools to do this. Some of the most notable advantages of RSI are as follows.
Just as they are advantages, so are the disadvantages. RSI just like some other tools that are used to evaluate the financial market, can’t be totally accurate. To be exact, no tool can totally report the potential movements in the market. In light of this, here are a few disadvantages of RSI.
The Relative Strength Index is a useful factor for consideration when about to make an entry, however, it isn’t compulsory. If you’re a trader that pays attention to technical analysis before deciding the play zone of a digital asset, you could make good use of it.
Nevertheless, RSI isn’t a totally accurate indicator. The financial market is very speculative, therefore, price movements cannot be dictated by a single indicator. Aside from RSI, one can still leverage other useful indicators.

What if you sold an ETH straddle daily for six months (June 2023 to Jan 2024)? How would your capital have grown? What levels of risk would you have been exposed to? Description of Trading Strategy Underlying Asset: ETHEREUM (ETH) Strategy Type: Daily ATM Straddle Selling (A straddle simultaneously
Technical analysis, brought into the traditional financial markets largely by journalist Charles Dow, is the method of using past market data to predict the future of a particular asset or the market as a whole. The basic theory of technical analysis is that when it comes to market trends, history r
Charles Dow, a prominent journalist and the founding figure of the Wall Street Journal, was one of the first people to point out that some market trends keep repeating themselves, and if monitored, they can give traders and investors an idea of what the future of a financial product or the overall m
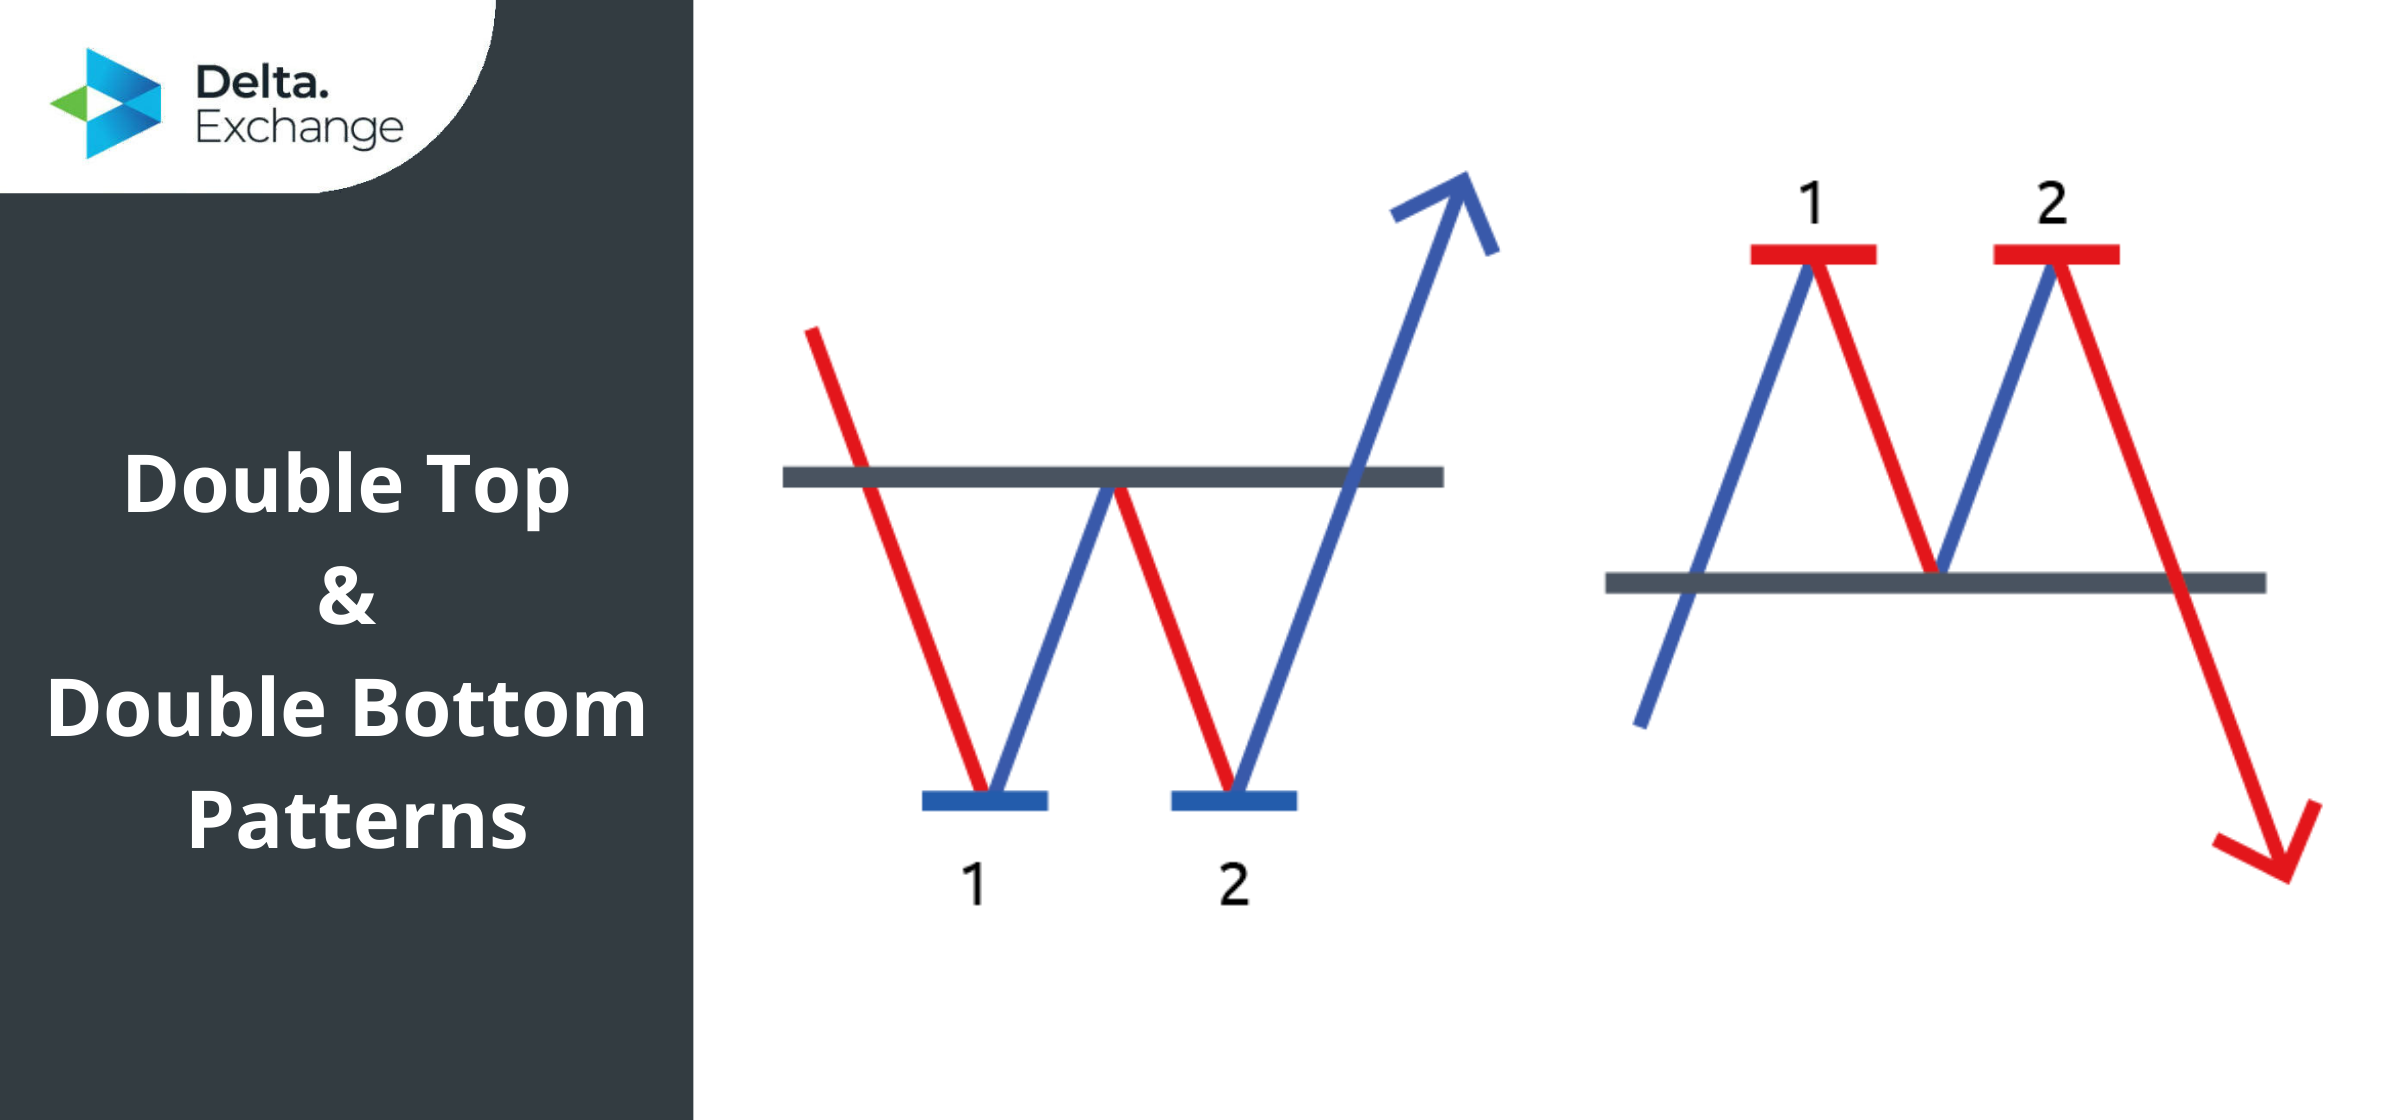
Trading with assets like cryptocurrencies and assets requires basic Technical Analysis(TA). Among these, double top and double bottom patterns are important trend reversal indicators that could possibly change the flow of an asset’s price action. Double top and Double bottom patterns are com
Stay Connected With News, Updates And More
